| Start Page |
|
 |
| Start Page |
|
|
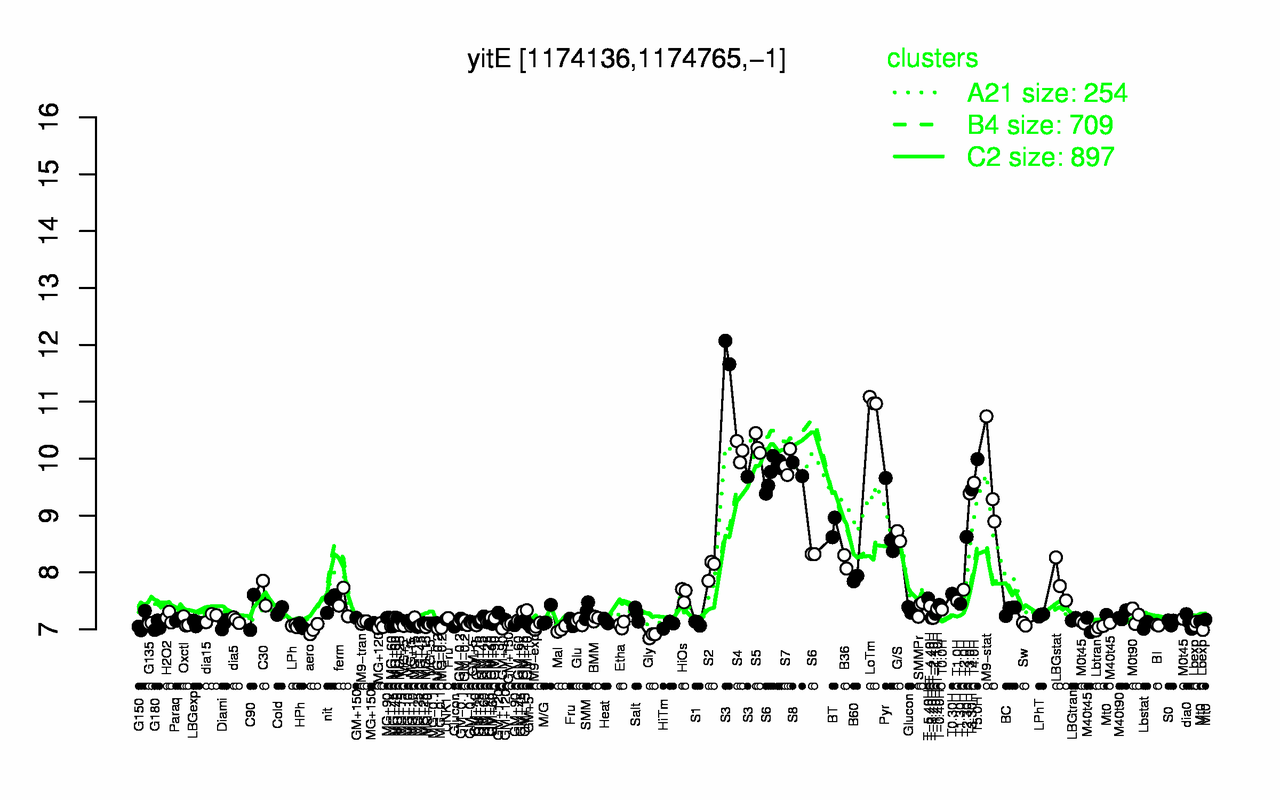
| S3 | LoTm | S5 | S4 | T5.0H | S7 | S8 | M9-stat | T4.0H | T3.30H |
| 11.1 | 11 | 10.2 | 10.1 | 9.99 | 9.92 | 9.81 | 9.64 | 9.58 | 9.46 |
| Gly | aero | Mal | MG-0.2 | Lbtran | M9-exp | G180 | MG+120 | HPh | Lbexp |
| 6.89 | 7 | 7 | 7.02 | 7.02 | 7.05 | 7.06 | 7.06 | 7.06 | 7.06 |