| Start Page |
|
 |
| Start Page |
|
|
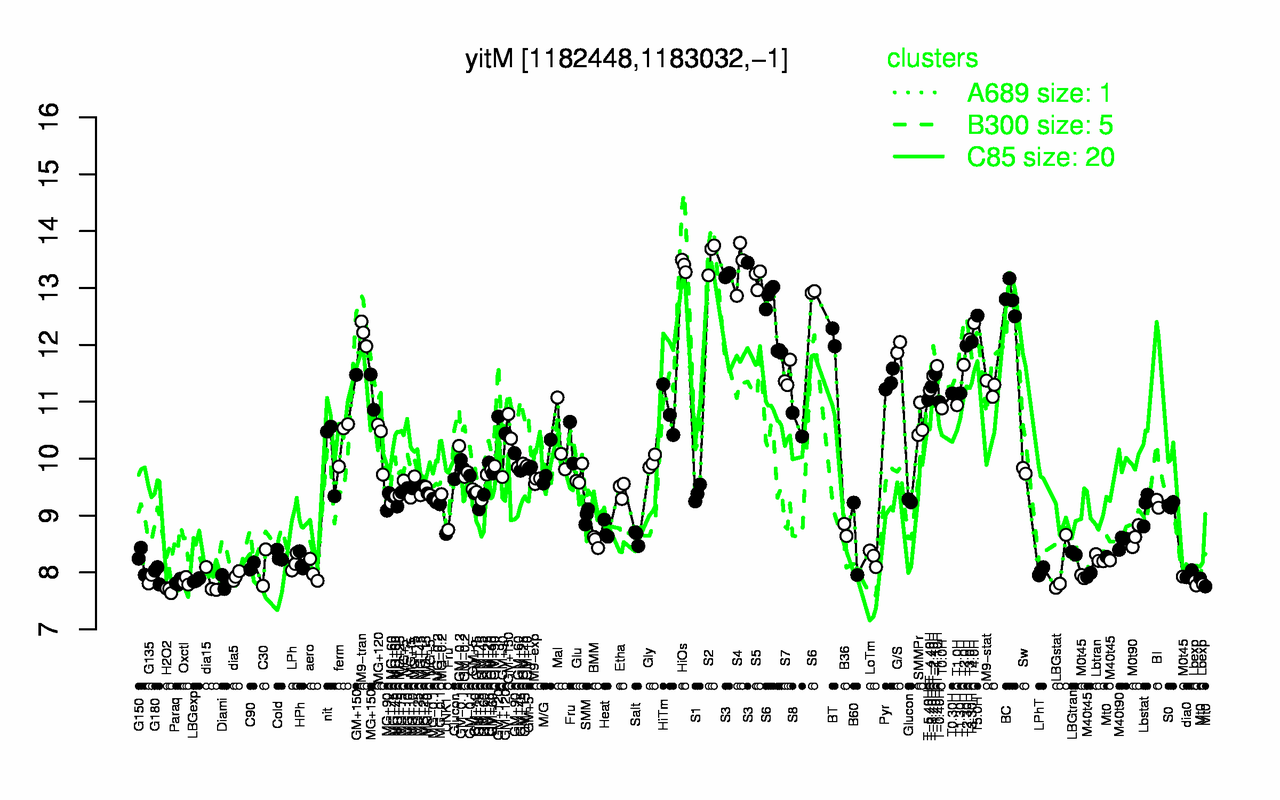
| S2 | HiOs | S4 | S3 | S5 | BC | S6 | T5.0H | T4.0H | M9-tran |
| 13.6 | 13.4 | 13.4 | 13.3 | 13.2 | 12.8 | 12.6 | 12.5 | 12.4 | 12.2 |
| H2O2 | Lbexp | Paraq | dia15 | Diami | Oxctl | LBGexp | G135 | M0t45 | dia5 |
| 7.69 | 7.8 | 7.83 | 7.83 | 7.84 | 7.84 | 7.86 | 7.88 | 7.93 | 7.93 |