| Start Page |
|
 |
| Start Page |
|
|
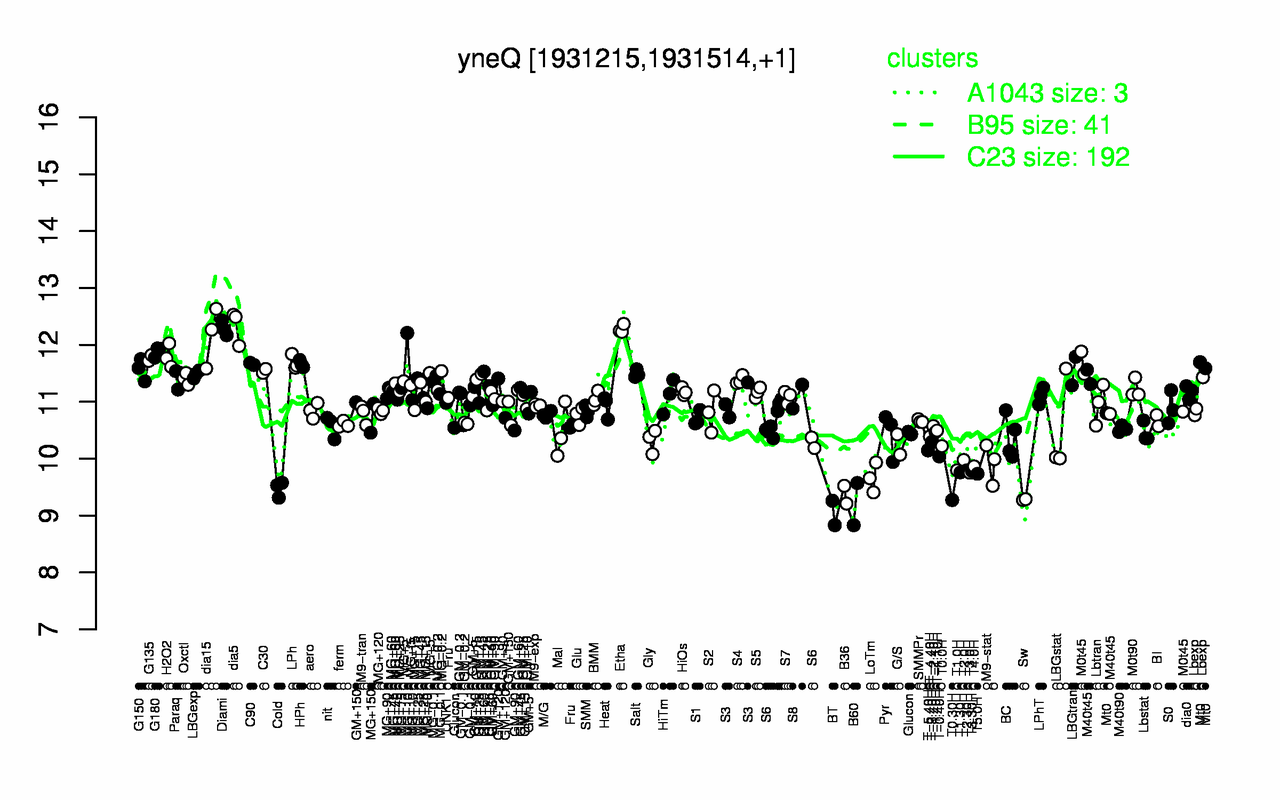
| dia5 | Diami | Etha | dia15 | G180 | H2O2 | G135 | LPh | HPh | C90 |
| 12.3 | 12.3 | 12.3 | 12.2 | 11.9 | 11.8 | 11.8 | 11.7 | 11.7 | 11.7 |
| BT | B60 | T0.30H | Sw | B36 | Cold | LoTm | T5.0H | T3.0H | T1.30H |
| 9.04 | 9.2 | 9.27 | 9.28 | 9.37 | 9.47 | 9.67 | 9.74 | 9.75 | 9.76 |