B. subtilis Expression Data Browser
Start Page
B. subtilis Expression Data Browser
Gene/Segment:
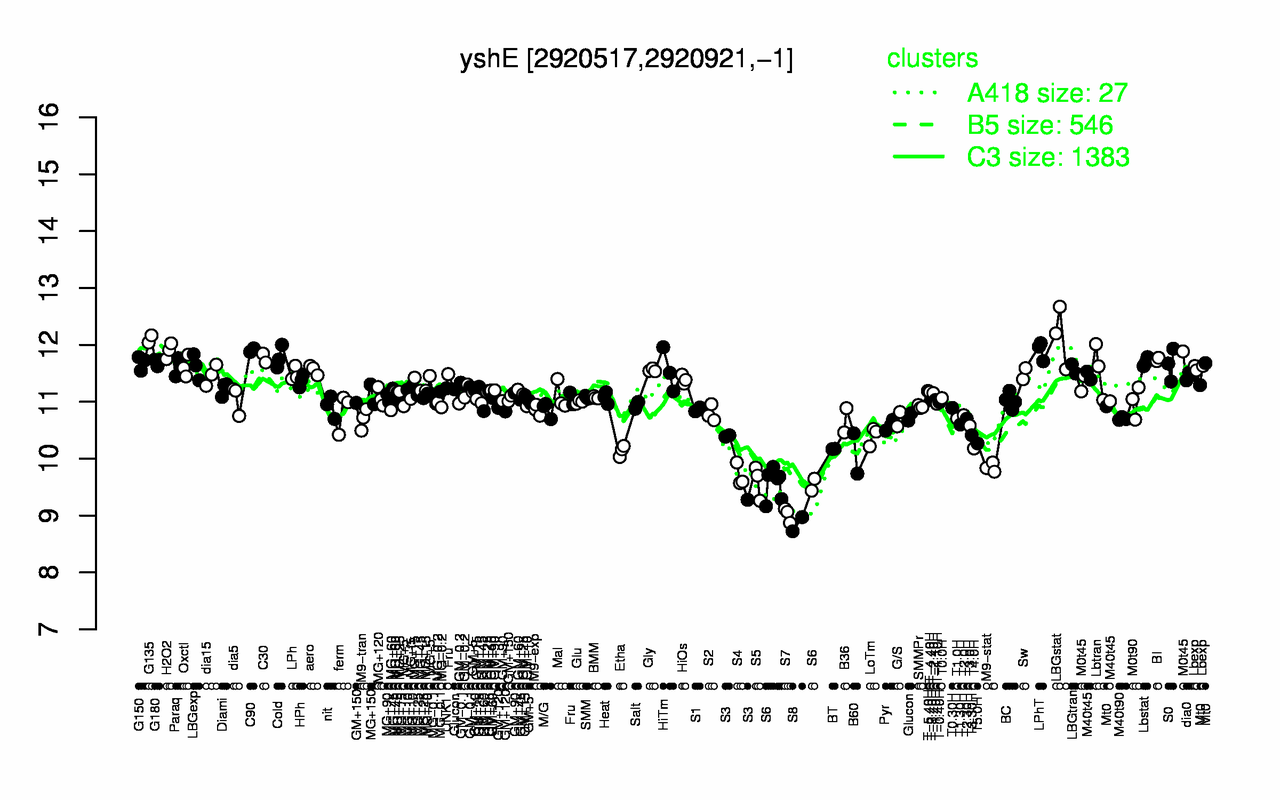
yshE
Locus Tag:
BSU28570
Details about yshE
Show/Hide
Highest Expression Conditions
LBGstat
G135
C90
LPhT
H2O2
Cold
C30
BI
G180
Lbstat
12.1
12.1
11.9
11.9
11.9
11.8
11.8
11.7
11.7
11.7
Lowest Expression Conditions
S8
S7
S6
S5
S4
M9-stat
S3
B60
Etha
BT
8.85
9.02
9.58
9.6
9.7
9.85
10
10.1
10.1
10.2
Most Positively Correlated Segments
yycJ
yebA
mutL
yeaD
yycI
walH
mprF
polX
pgsA
ydgF
0.91
0.91
0.9
0.89
0.89
0.89
0.88
0.87
0.87
0.85
Most Negatively Correlated Segments
yngHA
yhfW
glnH
glnQ
yngHB
yngG
yjbA
glnM
yodS
yodP
-0.83
-0.83
-0.83
-0.83
-0.82
-0.82
-0.82
-0.82
-0.82
-0.82
Expression Profile of Segment yshE
Show/Hide
Annotation of Gene yshE
Show/Hide
inference
ab initio prediction:AMIGene:2.0
codon_start
1
product
putative integral inner membrane protein
transl_table
11
note
Evidence 3: Function proposed based on presence of conserved amino acid motif, structural feature or limited homology; PubMedId: 15849754, 16850406; Product type pm: putative membrane component
db_xref
GI:2635322
protein_id
CAB14817.1
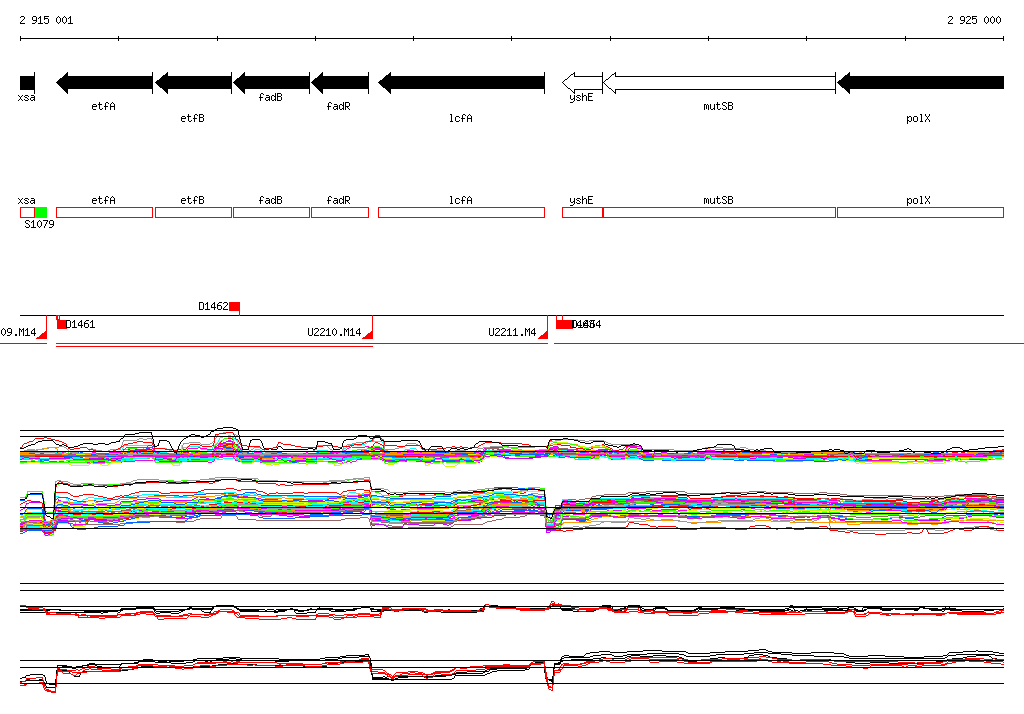
Genomic View of Gene/Segment yshE
Show/Hide
(Legend)
Browse Genome Context