| Start Page |
|
 |
| Start Page |
|
|
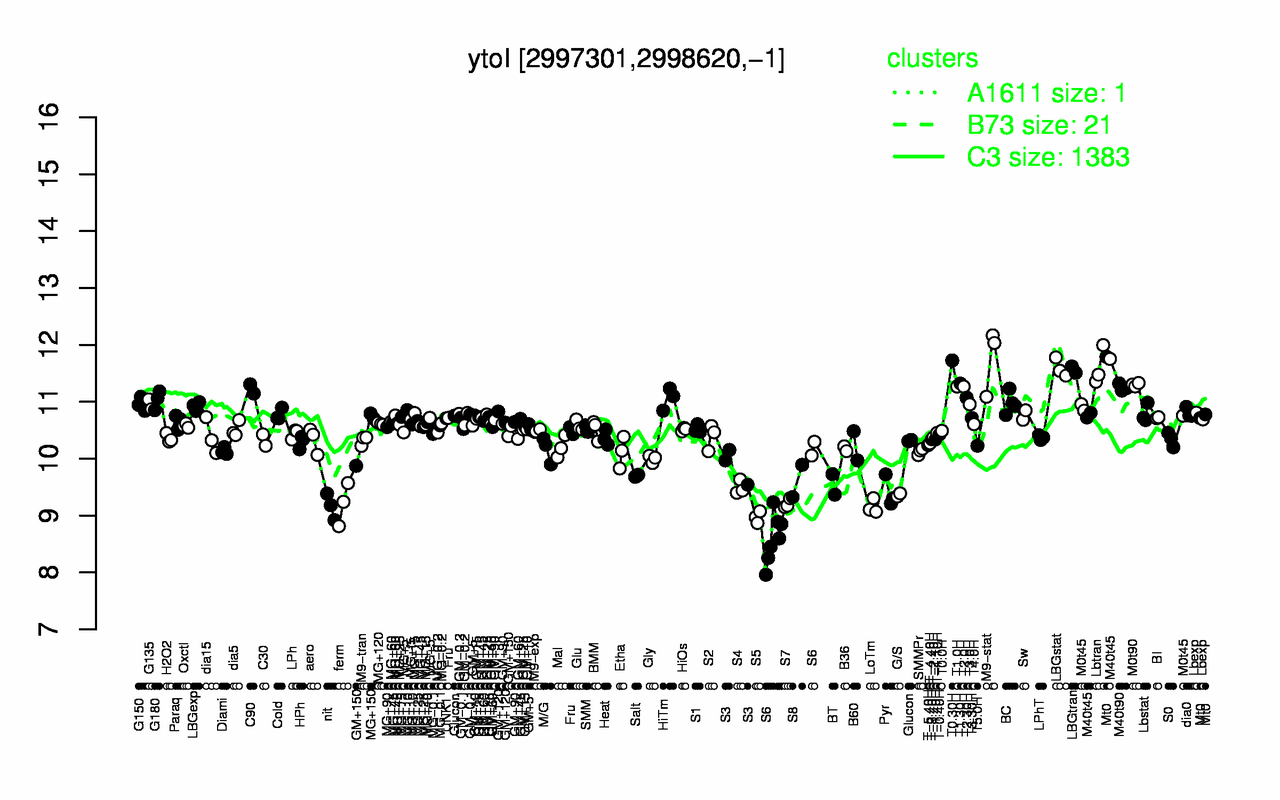
| M9-stat | T0.30H | Lbtran | LBGstat | LBGtran | T1.30H | M0t90 | T1.0H | T2.0H | M40t90 |
| 11.8 | 11.7 | 11.6 | 11.6 | 11.6 | 11.3 | 11.3 | 11.3 | 11.3 | 11.3 |
| S6 | S5 | LoTm | nit | S7 | ferm | G/S | Pyr | S4 | BT |
| 8.95 | 8.97 | 9.16 | 9.16 | 9.21 | 9.21 | 9.36 | 9.41 | 9.49 | 9.55 |