| Start Page |
|
 |
| Start Page |
|
|
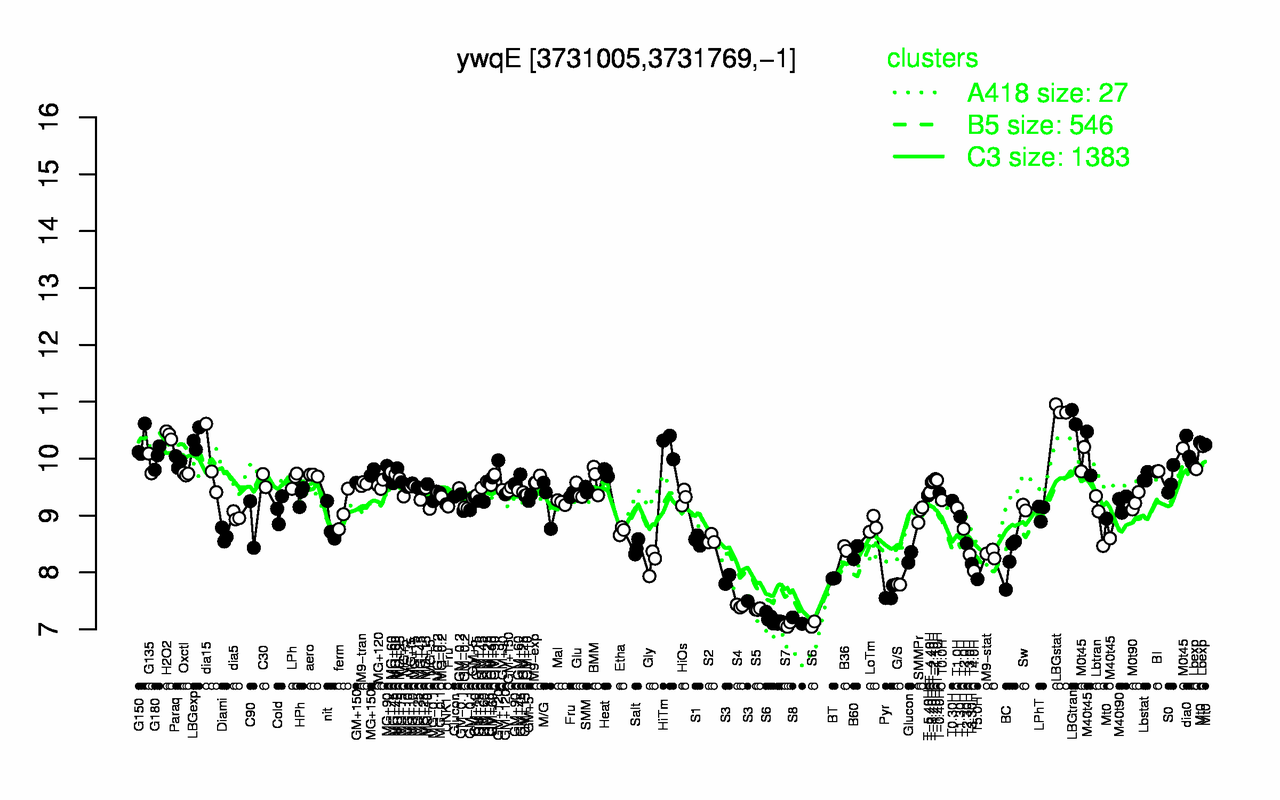
| LBGstat | LBGtran | H2O2 | LBGexp | G150 | HiTm | dia0 | M0t45 | G180 | Lbexp |
| 10.9 | 10.7 | 10.4 | 10.3 | 10.3 | 10.2 | 10.1 | 10.1 | 10 | 9.96 |
| S7 | S6 | S8 | S5 | S4 | Pyr | S3 | G/S | T5.0H | BT |
| 7.08 | 7.15 | 7.15 | 7.35 | 7.41 | 7.62 | 7.75 | 7.79 | 7.88 | 7.9 |