| Supplementary data of the associated publication Start Page |
|
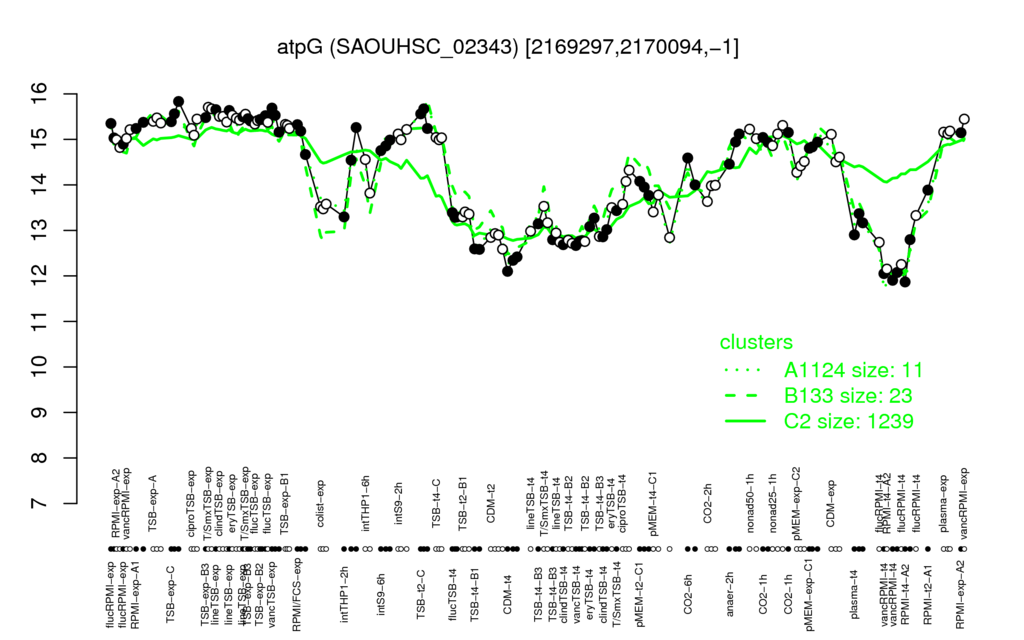
| T/SmxTSB-exp | lineTSB-exp | TSB-exp-C | TSB-t2-C | eryTSB-exp |
| 15.6 | 15.6 | 15.6 | 15.5 | 15.5 |
| vancRPMI-t4 | RPMI-t4-A2 | CDM-t4 | TSB-t4-B1 | vancTSB-t4 |
| 12 | 12.3 | 12.3 | 12.6 | 12.7 |
| atpA | atpD | atpF | S903 | S904 | atpH | atpE | SAOUHSC_02351 | atpB | atpC |
| 0.99 | 0.98 | 0.98 | 0.98 | 0.98 | 0.98 | 0.97 | 0.96 | 0.96 | 0.95 |
| S122 | SAOUHSC_00376 | SAOUHSC_02691 | S121 | SAOUHSC_00823 | S844 | S209 | S316 | S16 | SAOUHSC_00792 |
| -0.91 | -0.9 | -0.87 | -0.87 | -0.86 | -0.86 | -0.85 | -0.85 | -0.85 | -0.85 |
