| Supplementary data of the associated publication Start Page |
|
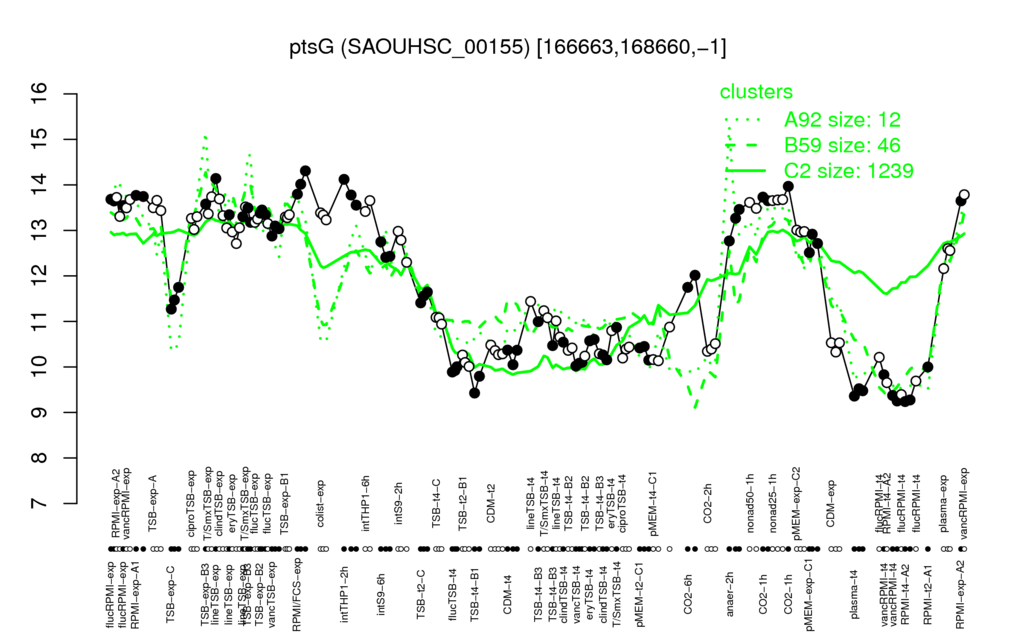
| RPMI/FCS-exp | intTHP1-2h | CO2-1h | RPMI-exp-A1 | nonad25-1h |
| 14 | 13.8 | 13.8 | 13.8 | 13.7 |
| RPMI-t4-A2 | plasma-t4 | vancRPMI-t4 | TSB-t4-B1 | flucRPMI-t4 |
| 9.39 | 9.45 | 9.48 | 9.61 | 9.77 |
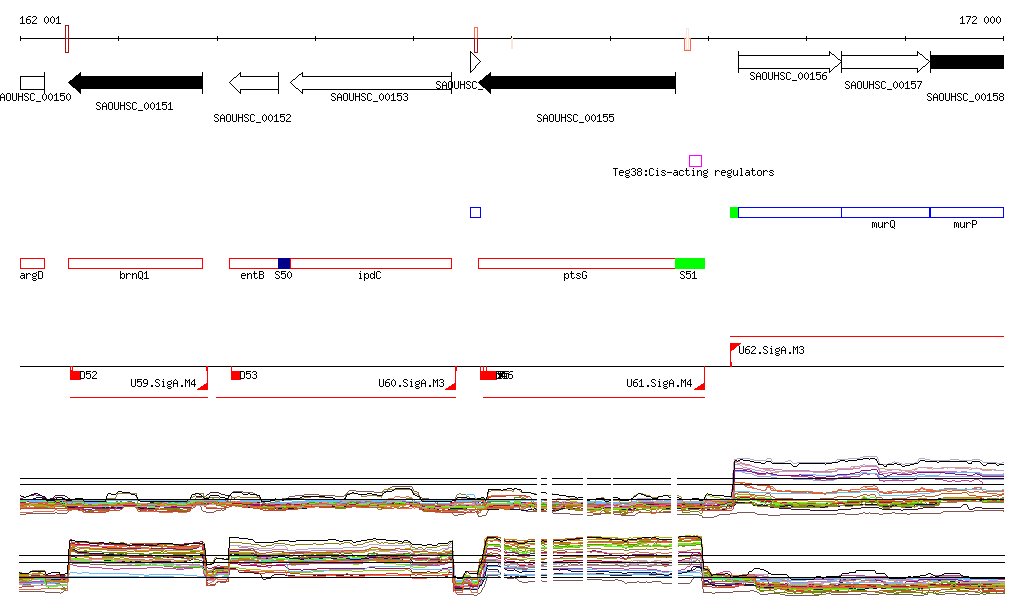
| S51 | tyrS | pyrR | S482 | SAOUHSC_01456 | S913 | mepA | aspS | SAOUHSC_01876 | SAOUHSC_00182 |
| 0.99 | 0.91 | 0.91 | 0.89 | 0.88 | 0.88 | 0.88 | 0.88 | 0.87 | 0.87 |
| appD | S122 | SAOUHSC_01024 | SAOUHSC_00376 | appF | SAOUHSC_02572 | S550 | ohrA | SAOUHSC_01854 | metX |
| -0.87 | -0.86 | -0.85 | -0.85 | -0.85 | -0.85 | -0.84 | -0.84 | -0.84 | -0.84 |