| Supplementary data of the associated publication Start Page |
|
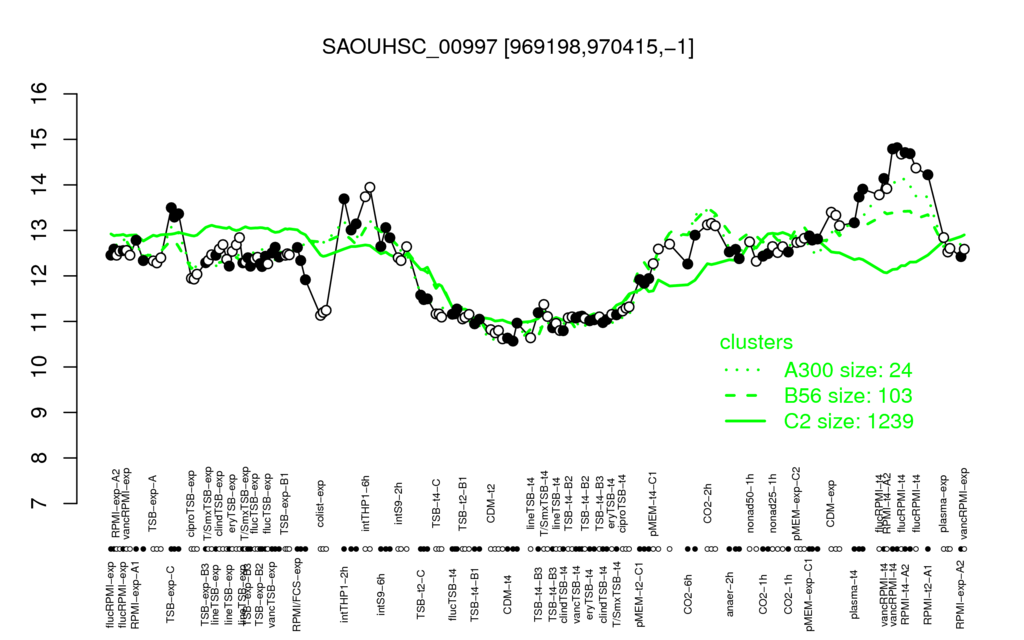
| vancRPMI-t4 | RPMI-t4-A2 | flucRPMI-t4 | RPMI-t2-A1 | intTHP1-6h |
| 14.6 | 14.4 | 14.3 | 14.2 | 13.8 |
| CDM-t4 | CDM-t2 | lineTSB-t4 | clindTSB-t4 | TSB-t4-B1 |
| 10.7 | 10.7 | 10.8 | 10.9 | 11 |
| S407 | S953 | SAOUHSC_00996 | SAOUHSC_02459 | SAOUHSC_02139 | SAOUHSC_02458 | S247 | S750 | S952 | S293 |
| 0.94 | 0.93 | 0.93 | 0.92 | 0.92 | 0.92 | 0.89 | 0.89 | 0.89 | 0.88 |
| S830 | S265 | deoB | dinP | recF | SAOUHSC_00041 | SAOUHSC_00099 | SAOUHSC_01606 | SAOUHSC_01861 | S643 |
| -0.88 | -0.88 | -0.87 | -0.87 | -0.86 | -0.86 | -0.85 | -0.84 | -0.84 | -0.83 |