| Supplementary data of the associated publication Start Page |
|
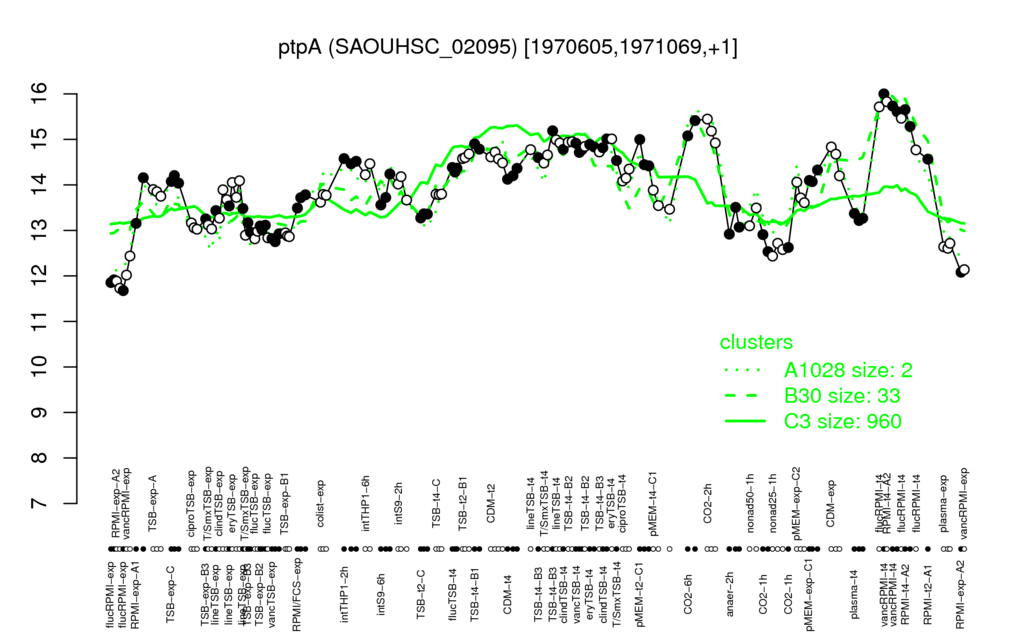
| vancRPMI-t4 | RPMI-t4-A2 | flucRPMI-t4 | CO2-6h | CO2-2h |
| 15.8 | 15.6 | 15.3 | 15.2 | 15.2 |
| flucRPMI-exp | RPMI-exp-A2 | vancRPMI-exp | nonad25-1h | plasma-exp |
| 11.8 | 11.9 | 12.2 | 12.6 | 12.7 |
| S351 | SAOUHSC_00826 | S342 | SAOUHSC_00356 | SAOUHSC_00358 | yabJ | S341 | SAOUHSC_02097 | SAOUHSC_02096 | S111 |
| 0.89 | 0.88 | 0.88 | 0.87 | 0.87 | 0.86 | 0.86 | 0.86 | 0.86 | 0.85 |
| fabD | htrA | fabG | SAOUHSC_01163 | S405 | SAOUHSC_01752 | ruvA | SAOUHSC_00669 | carA | plsX |
| -0.77 | -0.77 | -0.77 | -0.77 | -0.76 | -0.76 | -0.76 | -0.74 | -0.74 | -0.74 |