| Start Page |
|
 |
| Start Page |
|
|
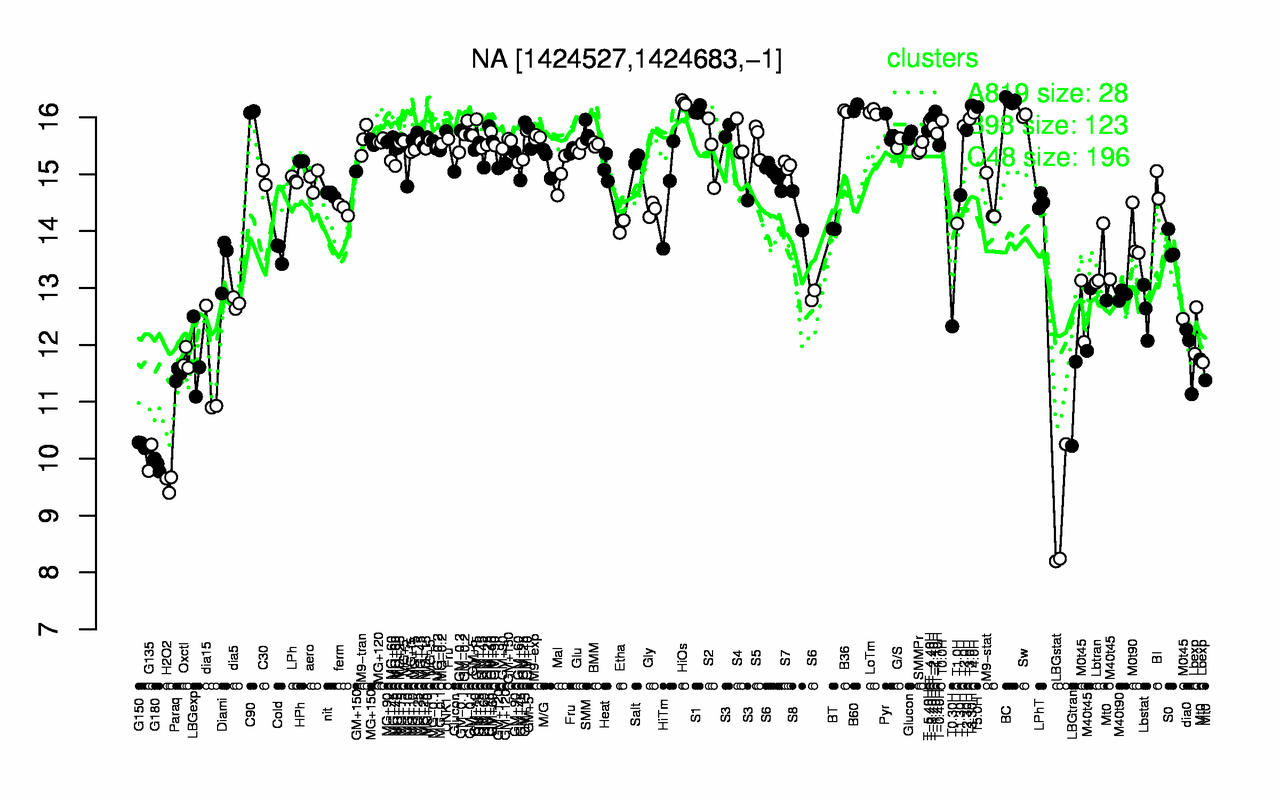
| BC | HiOs | T3.30H | T5.0H | B60 | S1 | B36 | T-1.40H | LoTm | C90 |
| 16.3 | 16.3 | 16.2 | 16.2 | 16.2 | 16.1 | 16.1 | 16.1 | 16.1 | 16.1 |
| LBGstat | H2O2 | G180 | G135 | G150 | LBGtran | Paraq | dia15 | LBGexp | Oxctl |
| 8.9 | 9.57 | 9.9 | 10 | 10.2 | 11 | 11.5 | 11.5 | 11.7 | 11.7 |