B. subtilis Expression Data Browser
Details about NA Show/Hide
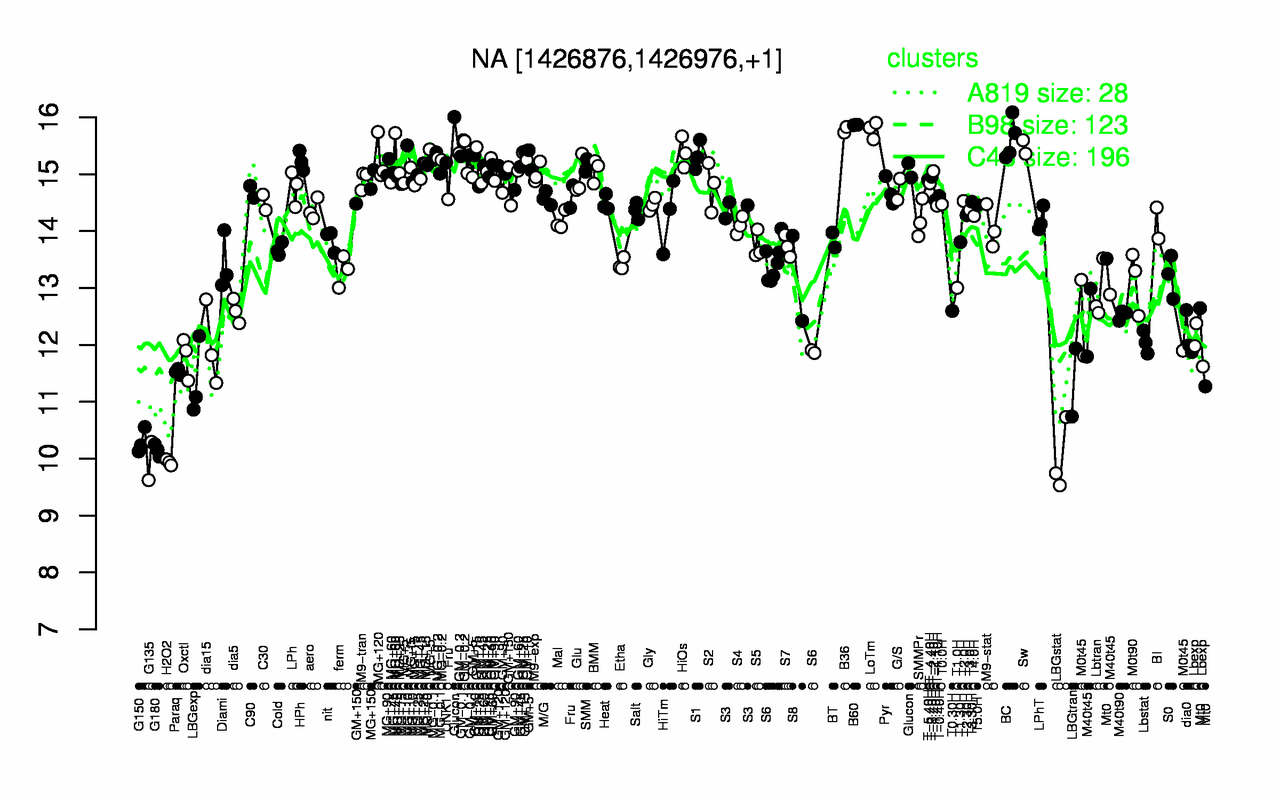
Highest Expression Conditions
B60 B36 LoTm BC Sw GM-0.1 HiOs Glucon S1 GM-0.2
15.9 15.8 15.8 15.6 15.5 15.4 15.4 15.4 15.3 15.3
Lowest Expression Conditions
H2O2 G135 LBGstat G180 G150 LBGtran LBGexp Paraq Oxctl dia15
9.94 9.96 10 10.1 10.3 11.3 11.4 11.5 11.8 12
Most Positively Correlated Segments
NA mtnU mtnK mtnA ilvA ilvB mtnE ilvH NA ilvD
0.94 0.93 0.92 0.92 0.91 0.91 0.9 0.9 0.9 0.9
Most Negatively Correlated Segments
pbuE S520 yyzE bglA yfkO S1542 sigV yyzO rsiV murF
-0.77 -0.77 -0.75 -0.75 -0.75 -0.75 -0.74 -0.73 -0.73 -0.72
Expression Profile of Segment NA Show/Hide
Genomic View of Gene/Segment NA Show/Hide
(Legend)