B. subtilis Expression Data Browser
Start Page
B. subtilis Expression Data Browser
Gene/Segment:
NA
Locus Tag:
BSU_misc_RNA_47
Details about NA
Show/Hide
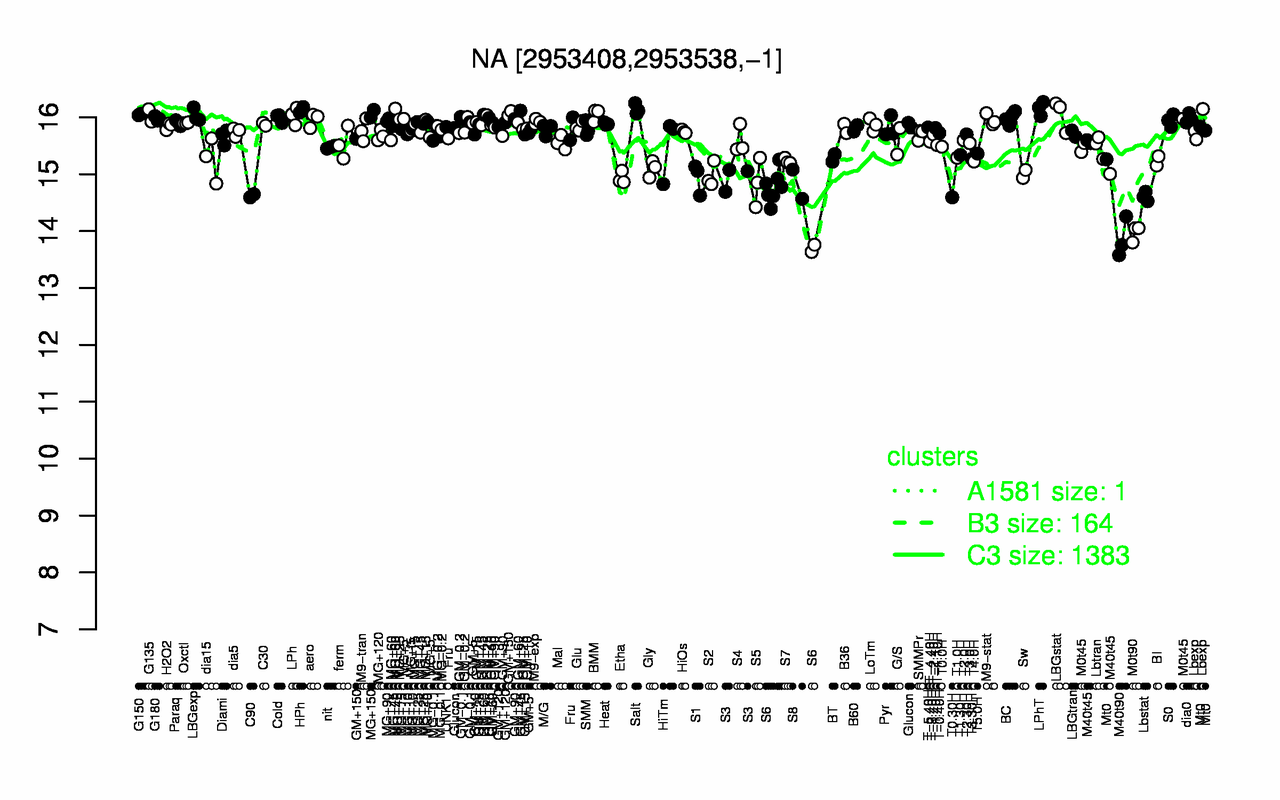
Highest Expression Conditions
LPhT
Salt
HPh
MG+150
G150
LBGstat
BMM
LBGexp
G135
LPh
16.2
16.1
16.1
16.1
16.1
16
16
16
16
16
Lowest Expression Conditions
M40t90
M0t90
S6
T0.30H
Lbstat
C90
S8
S5
Etha
S1
13.9
14
14.5
14.6
14.6
14.6
14.8
14.9
14.9
14.9
Most Positively Correlated Segments
infC
rpmI
rpmEA
rpsC
rpmC
rplT
rplP
rpsNA
rplV
yugI
0.85
0.83
0.8
0.79
0.79
0.79
0.78
0.78
0.78
0.78
Most Negatively Correlated Segments
yugM
amyD
amyC
S1195
yugN
msmE
iolT
melA
iolJ
S1097
-0.71
-0.7
-0.7
-0.69
-0.69
-0.68
-0.68
-0.68
-0.64
-0.64
Expression Profile of Segment NA
Show/Hide
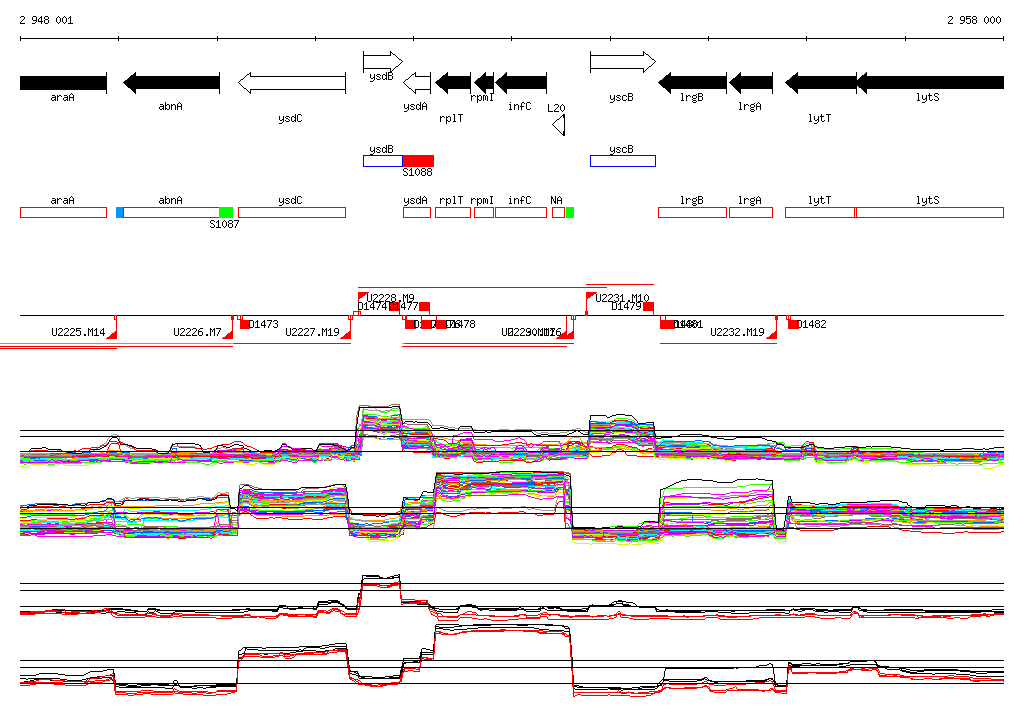
Genomic View of Gene/Segment NA
Show/Hide
(Legend)
Browse Genome Context