| Start Page |
|
 |
| Start Page |
|
|
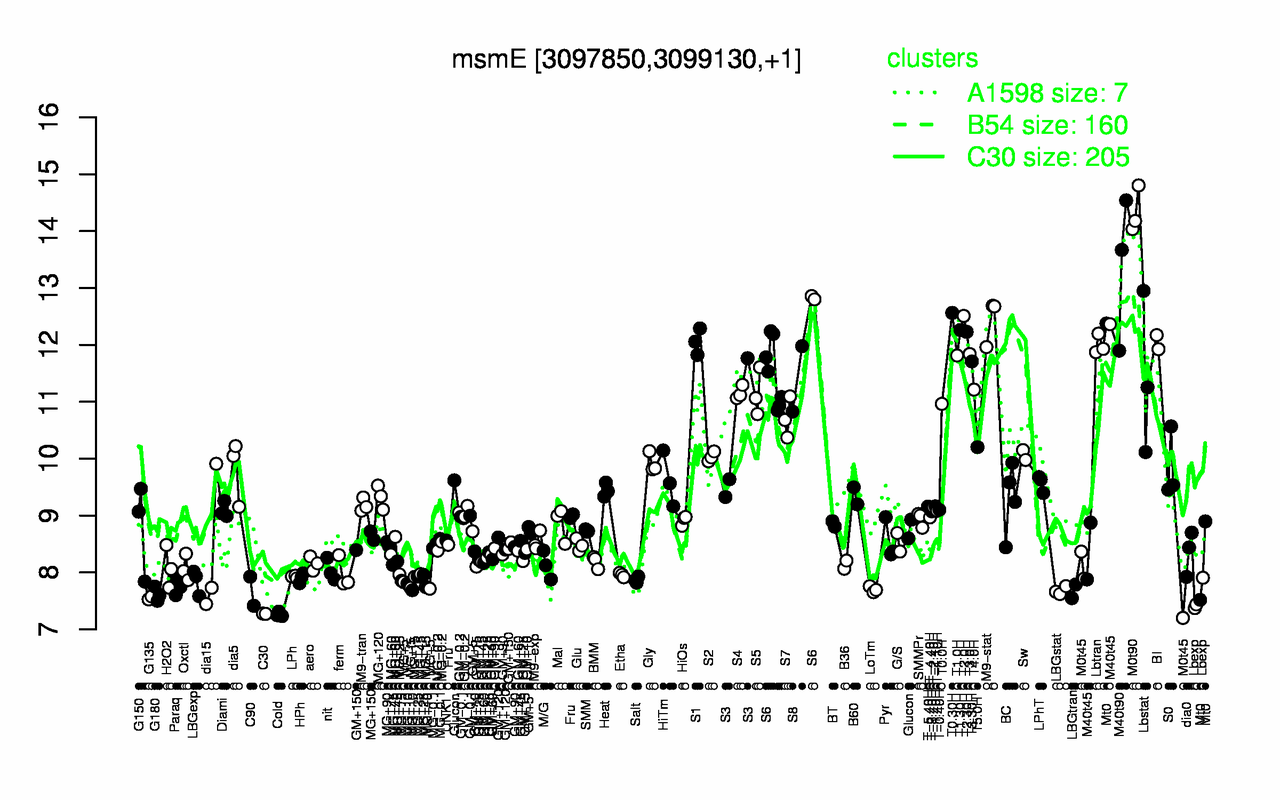
| M0t90 | M40t90 | T0.30H | T2.0H | M9-stat | T1.30H | T2.30H | S1 | BI | Lbtran |
| 14.3 | 13.4 | 12.6 | 12.5 | 12.4 | 12.3 | 12.2 | 12.1 | 12 | 12 |
| Cold | C30 | G135 | Lbexp | G180 | LBGtran | C90 | LBGstat | LoTm | MG+t5 |
| 7.26 | 7.27 | 7.55 | 7.57 | 7.62 | 7.67 | 7.67 | 7.68 | 7.7 | 7.73 |