| Start Page |
|
 |
| Start Page |
|
|
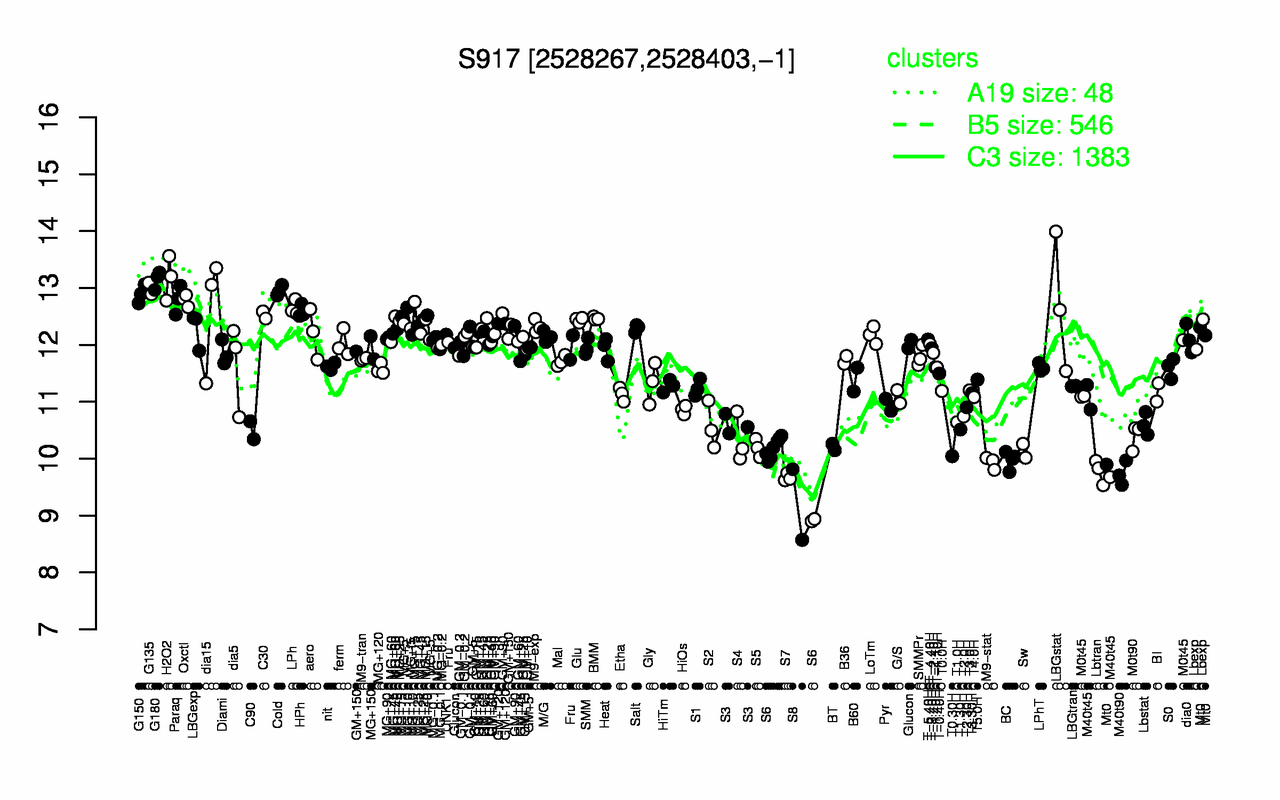
| H2O2 | G180 | G135 | Cold | G150 | Paraq | Oxctl | LBGstat | LPh | HPh |
| 13.2 | 13.1 | 13 | 12.9 | 12.9 | 12.8 | 12.8 | 12.7 | 12.7 | 12.6 |
| S8 | S7 | M40t90 | Lbtran | S6 | M9-stat | BC | T0.30H | Sw | S5 |
| 9.19 | 9.67 | 9.74 | 9.78 | 9.91 | 9.93 | 9.98 | 10 | 10.1 | 10.2 |