| Start Page |
|
 |
| Start Page |
|
|
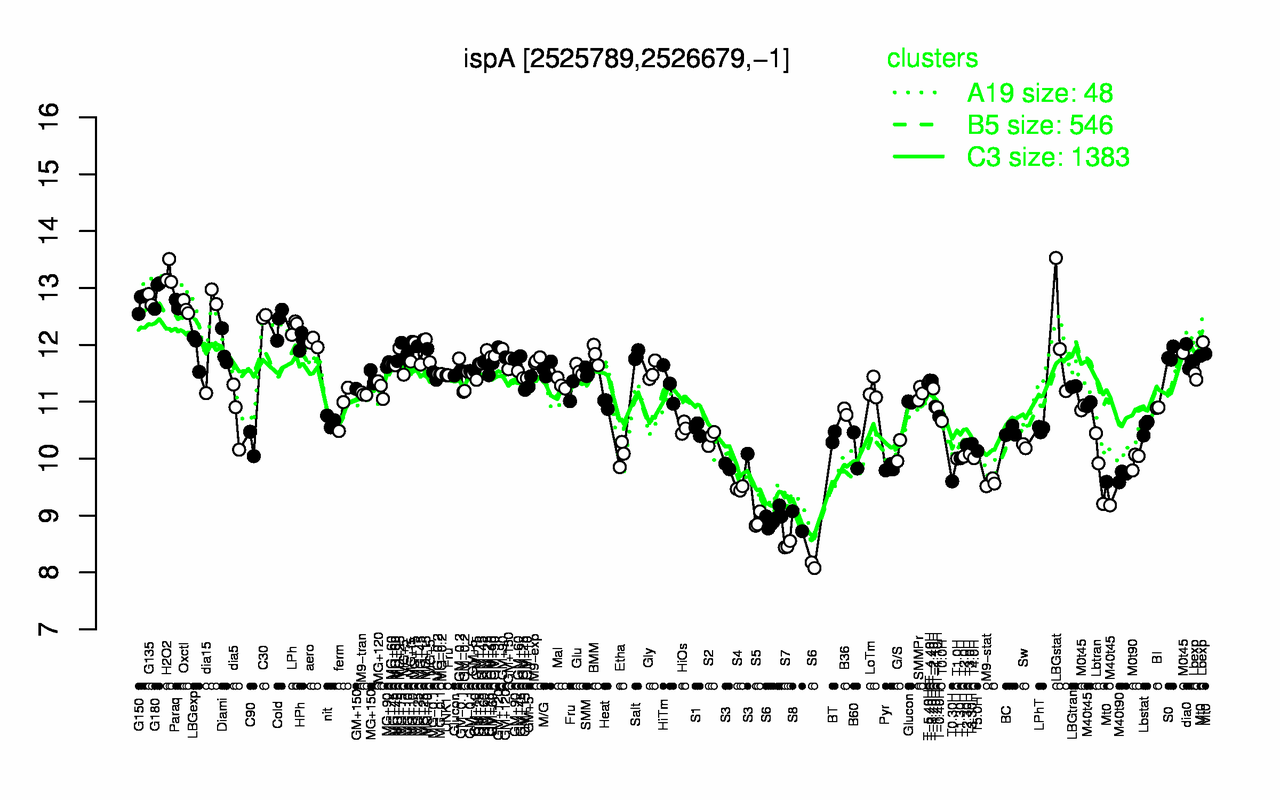
| H2O2 | G180 | G135 | G150 | Paraq | Oxctl | C30 | Cold | LPh | dia15 |
| 13.3 | 12.9 | 12.8 | 12.8 | 12.7 | 12.7 | 12.5 | 12.4 | 12.3 | 12.3 |
| S7 | S6 | S8 | S5 | S4 | M9-stat | T0.30H | M40t90 | Pyr | Lbtran |
| 8.48 | 8.76 | 8.9 | 8.91 | 9.47 | 9.58 | 9.6 | 9.7 | 9.84 | 9.86 |