| Start Page |
|
 |
| Start Page |
|
|
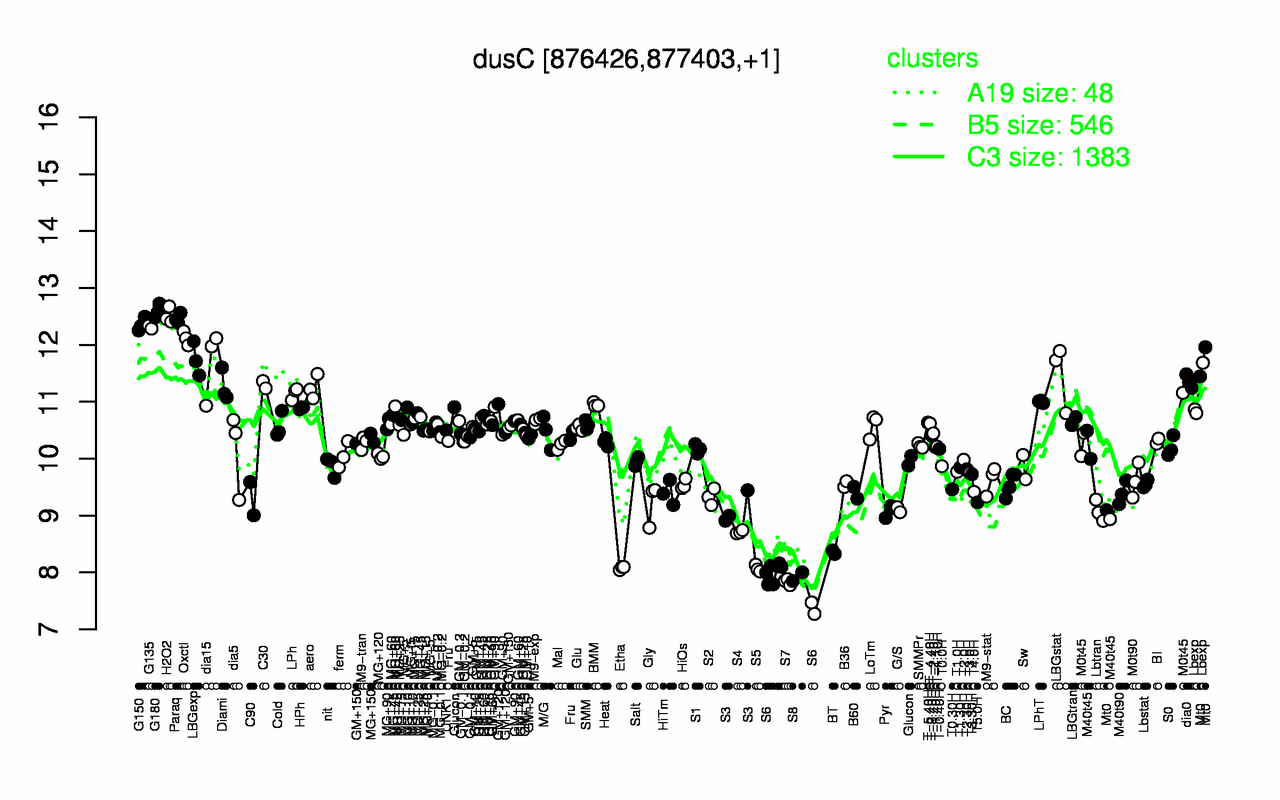
| G180 | H2O2 | Paraq | G150 | G135 | Oxctl | LBGexp | dia15 | LBGstat | dia0 |
| 12.6 | 12.5 | 12.5 | 12.4 | 12.3 | 12.1 | 11.7 | 11.7 | 11.5 | 11.4 |
| S7 | S6 | S8 | S5 | Etha | BT | S4 | Lbtran | Pyr | G/S |
| 7.84 | 7.87 | 7.92 | 8.07 | 8.08 | 8.36 | 8.71 | 9.08 | 9.08 | 9.1 |