| Start Page |
|
 |
| Start Page |
|
|
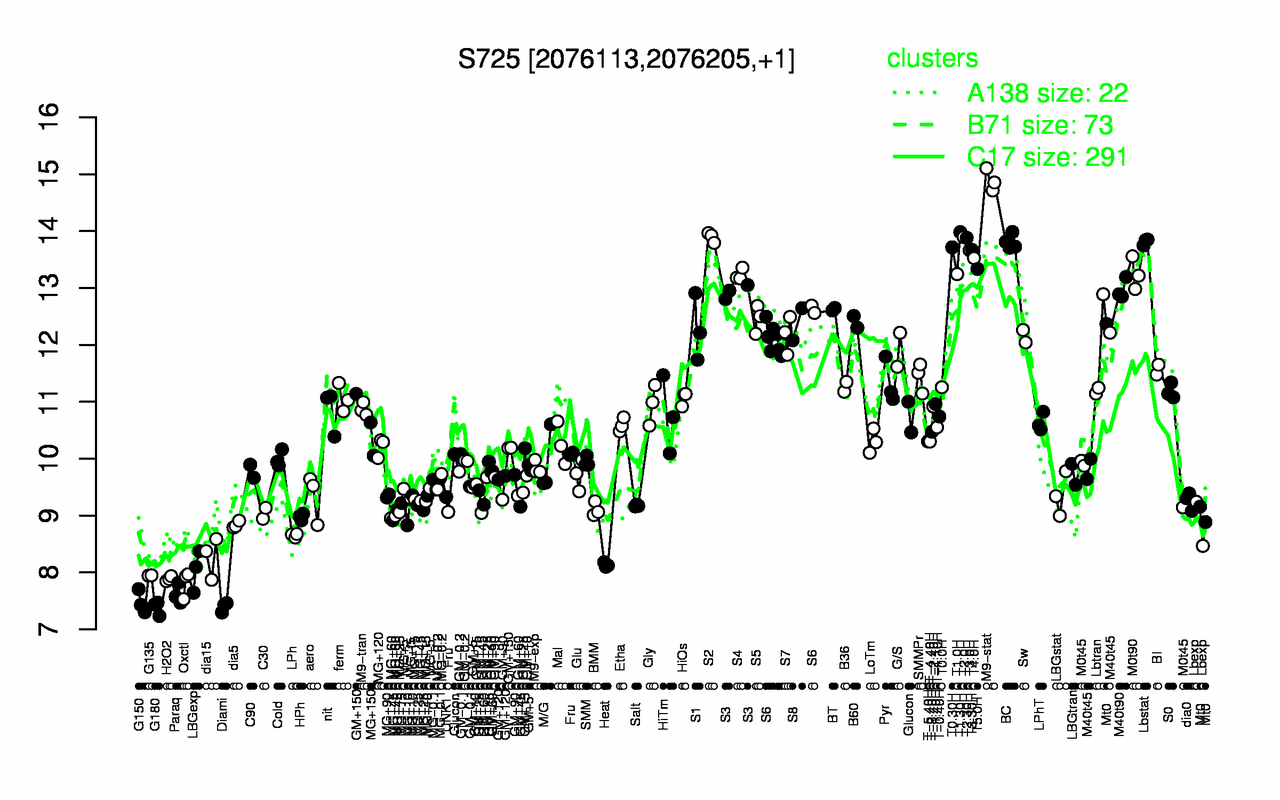
| M9-stat | T1.30H | T2.0H | S2 | T2.30H | Lbstat | BC | T0.30H | T3.30H | T3.0H |
| 14.9 | 14 | 13.9 | 13.9 | 13.9 | 13.8 | 13.8 | 13.7 | 13.7 | 13.7 |
| G180 | Diami | G150 | Paraq | Oxctl | H2O2 | G135 | LBGexp | Heat | dia15 |
| 7.38 | 7.4 | 7.48 | 7.62 | 7.81 | 7.89 | 7.95 | 8.04 | 8.13 | 8.28 |