| Start Page |
|
 |
| Start Page |
|
|
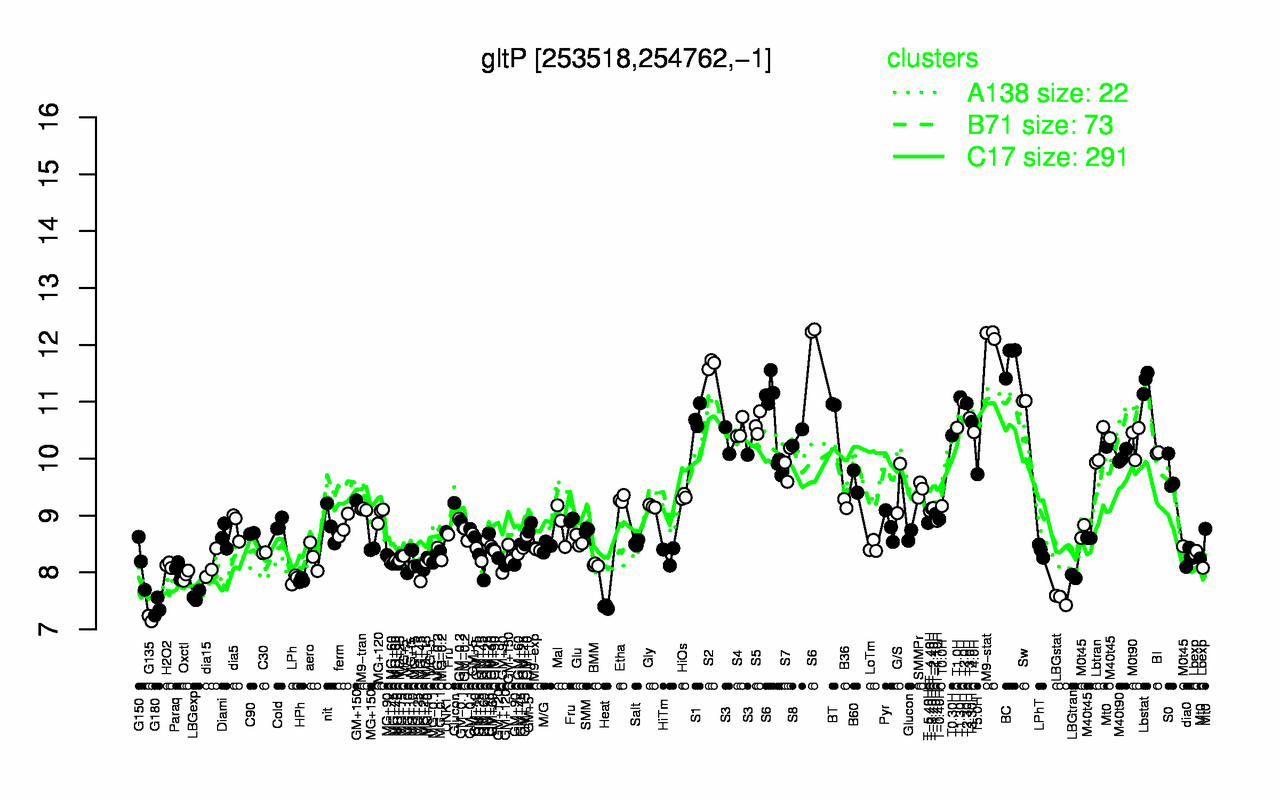
| M9-stat | BC | S2 | Lbstat | T1.30H | Sw | T2.0H | S6 | T2.30H | BT |
| 12.2 | 11.8 | 11.7 | 11.3 | 11.1 | 11 | 11 | 11 | 11 | 11 |
| G135 | G180 | Heat | LBGstat | LBGexp | HPh | LPh | LBGtran | Oxctl | Paraq |
| 7.19 | 7.38 | 7.39 | 7.53 | 7.59 | 7.86 | 7.88 | 7.93 | 7.95 | 8.04 |