| Start Page |
|
 |
| Start Page |
|
|
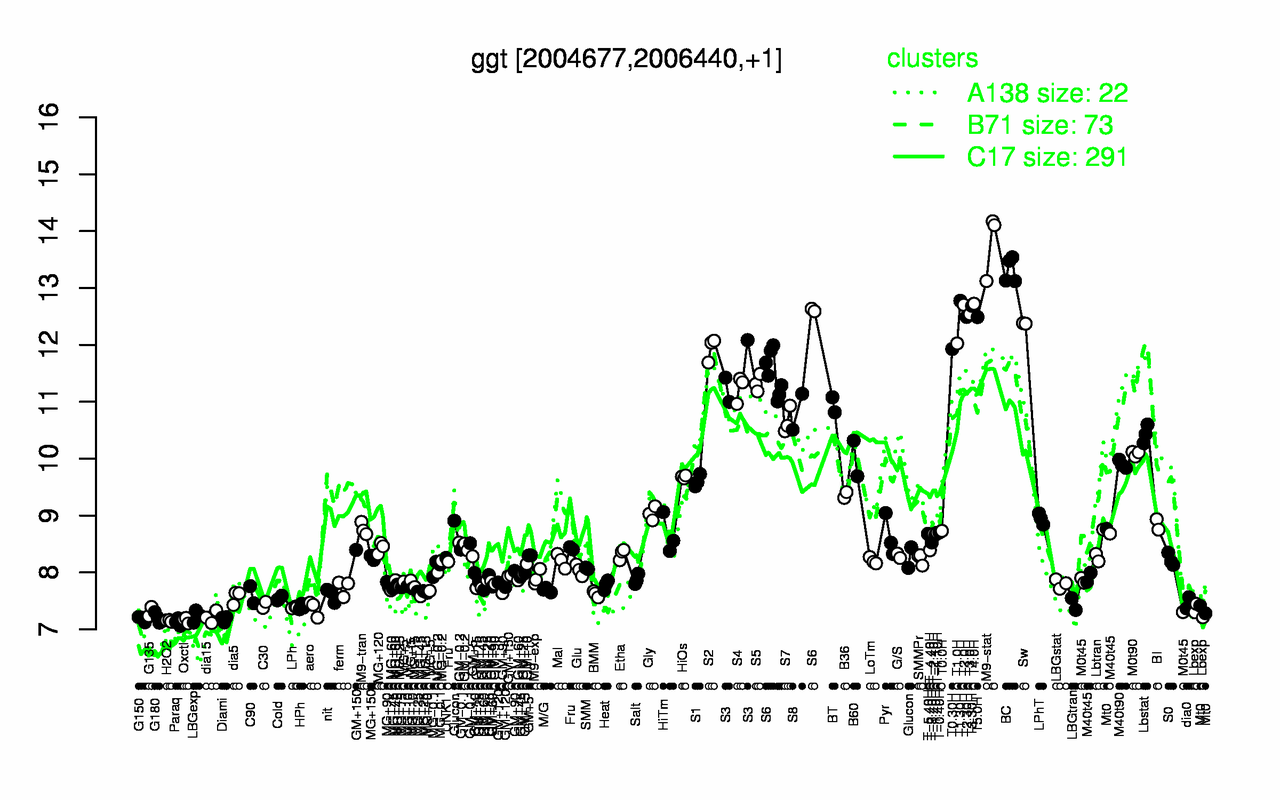
| M9-stat | BC | T1.30H | T4.0H | T2.0H | T3.30H | T3.0H | T2.30H | T5.0H | Sw |
| 13.8 | 13.3 | 12.8 | 12.7 | 12.7 | 12.7 | 12.5 | 12.5 | 12.5 | 12.4 |
| Paraq | H2O2 | Oxctl | Diami | G150 | G180 | dia15 | LBGexp | G135 | Lbexp |
| 7.13 | 7.15 | 7.16 | 7.18 | 7.18 | 7.21 | 7.22 | 7.23 | 7.31 | 7.32 |