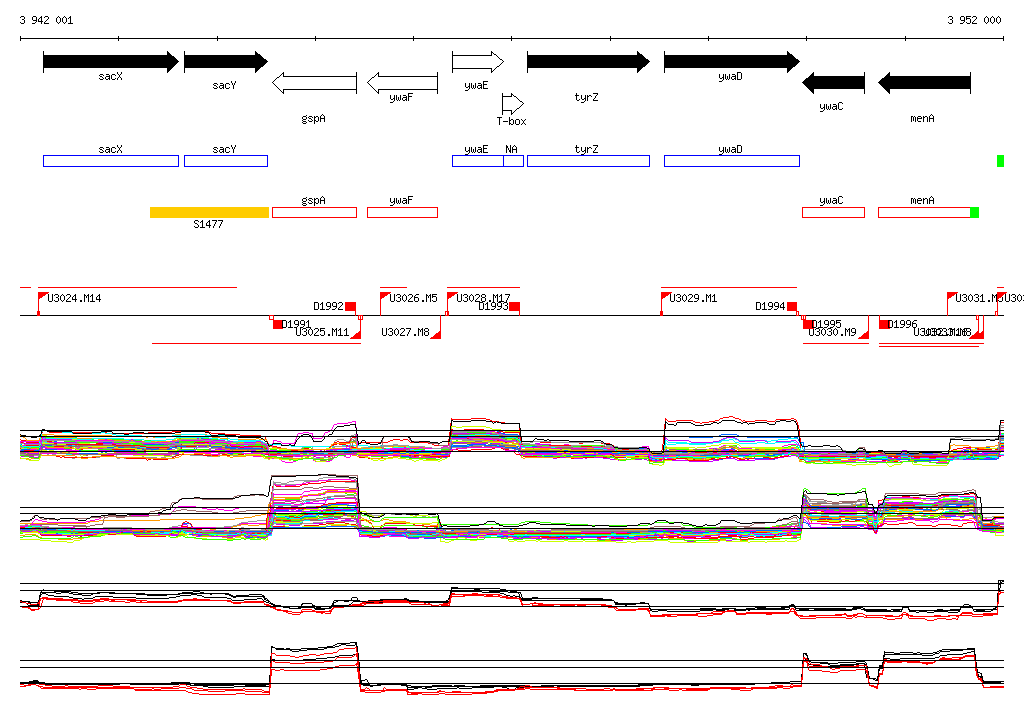
| Start Page |
|
 |
| Start Page |
|
|
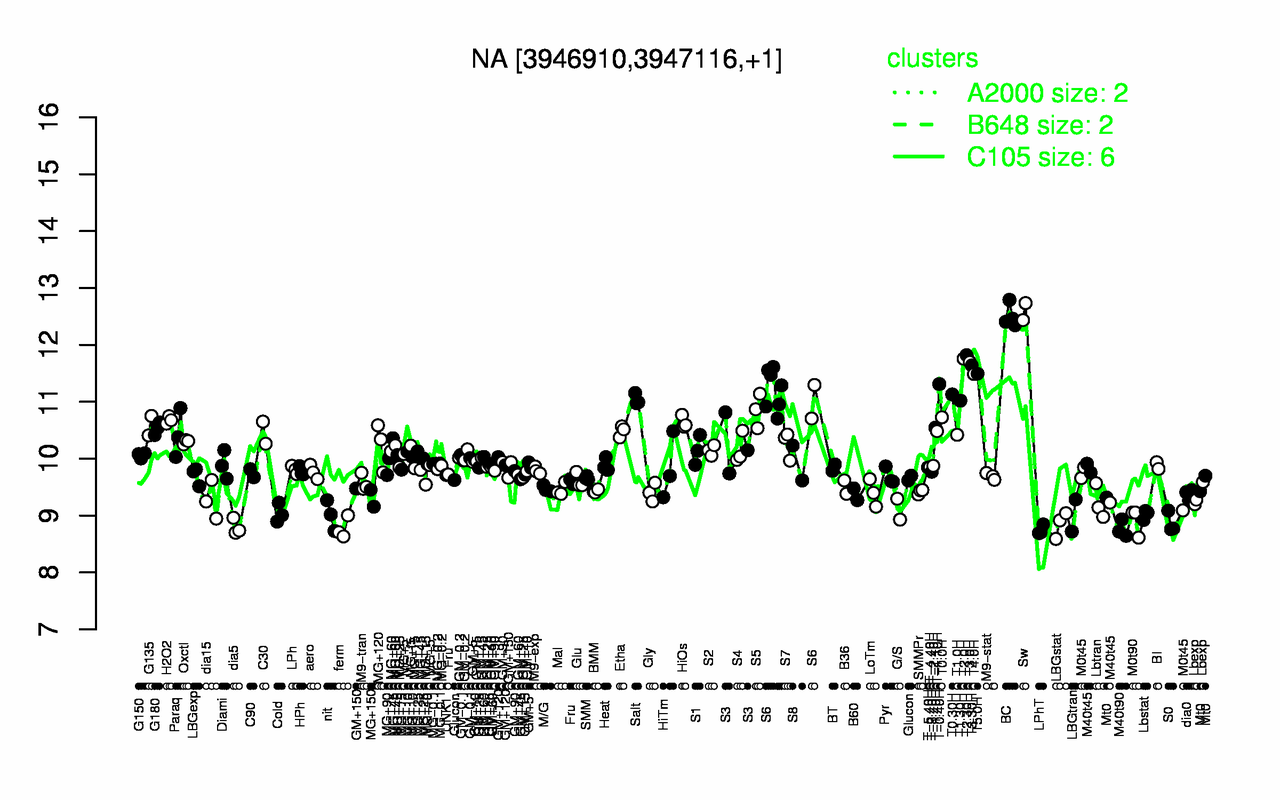
| Sw | BC | T2.30H | T2.0H | T3.0H | T3.30H | T5.0H | T4.0H | T-0.40H | S6 |
| 12.6 | 12.5 | 11.8 | 11.8 | 11.7 | 11.6 | 11.5 | 11.5 | 11.3 | 11.2 |
| LPhT | M40t90 | ferm | dia5 | LBGstat | S0 | M0t90 | LBGtran | nit | Lbstat |
| 8.75 | 8.77 | 8.78 | 8.8 | 8.85 | 8.87 | 8.91 | 9 | 9.01 | 9.02 |