| Start Page |
|
 |
| Start Page |
|
|
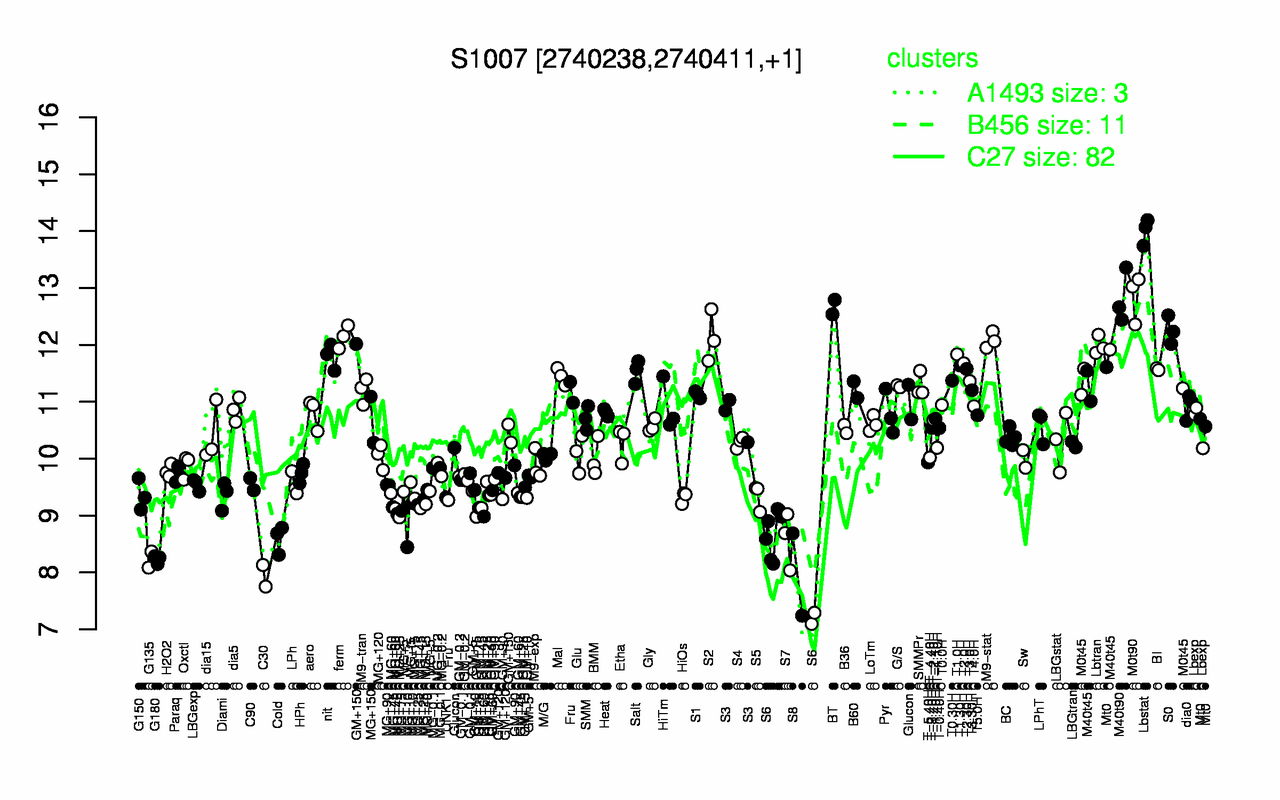
| Lbstat | M0t90 | M40t90 | BT | S0 | ferm | S2 | M9-stat | Lbtran | T1.0H |
| 14 | 12.8 | 12.8 | 12.7 | 12.3 | 12.1 | 12.1 | 12.1 | 12 | 11.8 |
| C30 | S8 | G135 | G180 | S6 | S7 | Cold | MG+10 | MG+45 | MG+25 |
| 7.94 | 7.96 | 8.23 | 8.23 | 8.38 | 8.58 | 8.59 | 9.04 | 9.1 | 9.14 |