| Start Page |
|
 |
| Start Page |
|
|
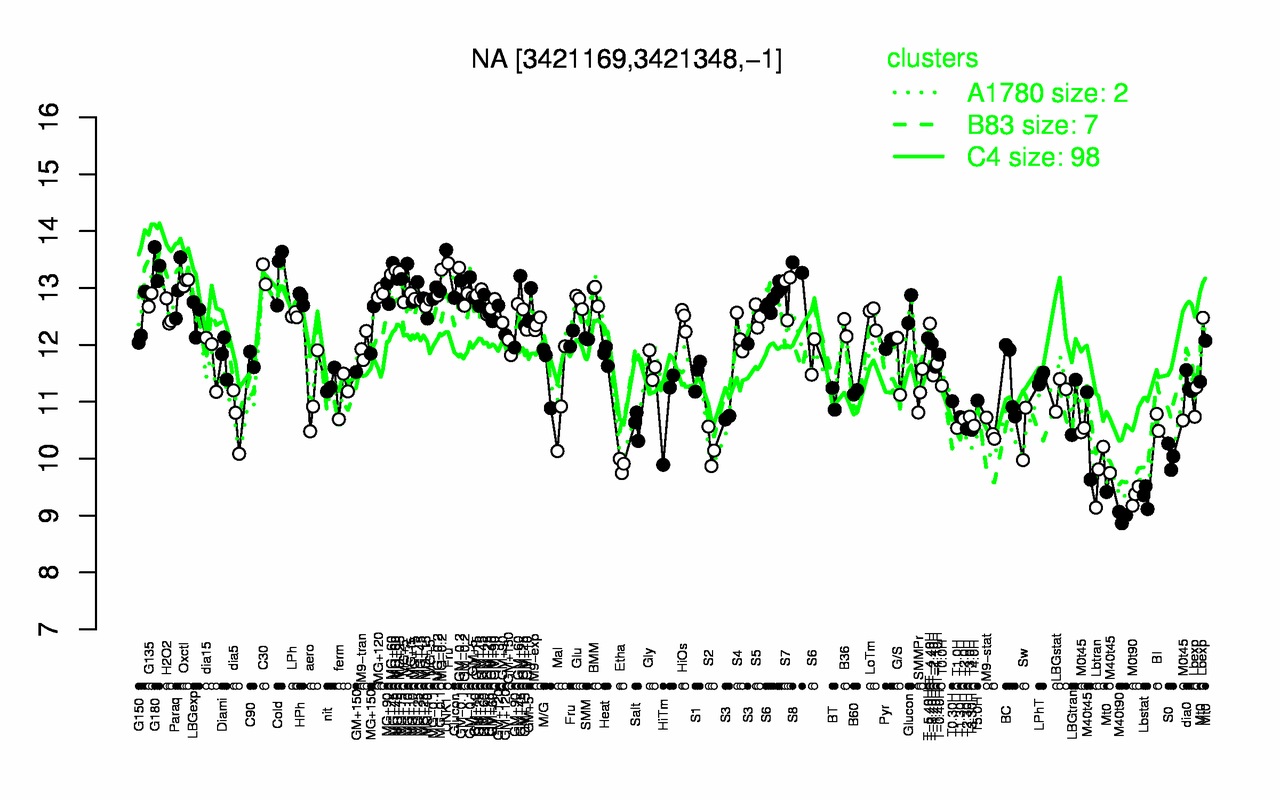
| UNK1 | G180 | S8 | MG+60 | Cold | C30 | MG+45 | Oxctl | MG-0.2 | MG+25 |
| 13.7 | 13.4 | 13.4 | 13.3 | 13.3 | 13.2 | 13.1 | 13.1 | 13.1 | 13.1 |
| M40t90 | Lbstat | M0t90 | Lbtran | Etha | S0 | M40t45 | S2 | Sw | M9-stat |
| 8.98 | 9.33 | 9.35 | 9.72 | 9.88 | 10 | 10.2 | 10.2 | 10.4 | 10.5 |