| Start Page |
|
 |
| Start Page |
|
|
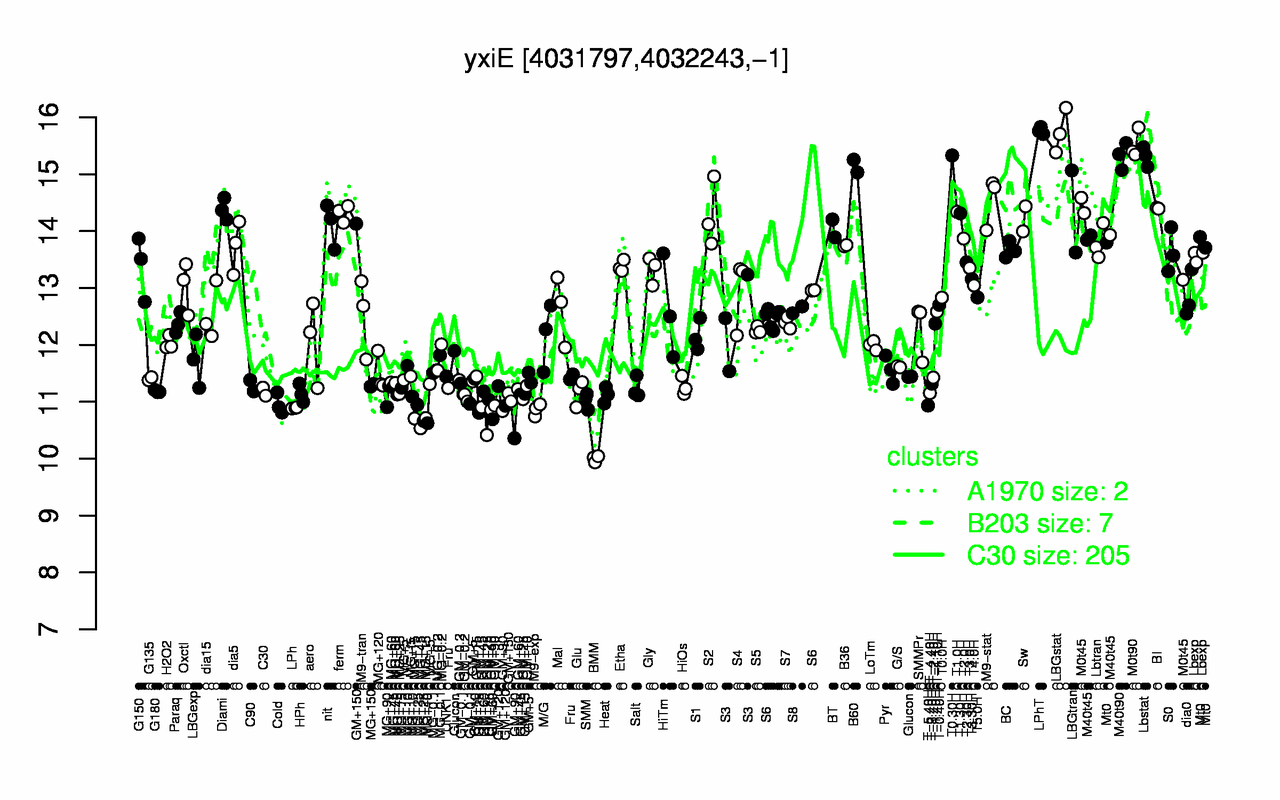
| LPhT | LBGstat | M0t90 | T0.30H | M40t90 | Lbstat | B60 | M9-stat | BI | Diami |
| 15.8 | 15.8 | 15.5 | 15.3 | 15.3 | 15.3 | 15.1 | 14.5 | 14.4 | 14.4 |
| BMM | GM+90 | GM+25 | M9-exp | MG+15 | LPh | MG+25 | T-5.40H | Cold | GM+45 |
| 10 | 10.7 | 10.8 | 10.9 | 10.9 | 10.9 | 10.9 | 10.9 | 11 | 11 |