| Start Page |
|
 |
| Start Page |
|
|
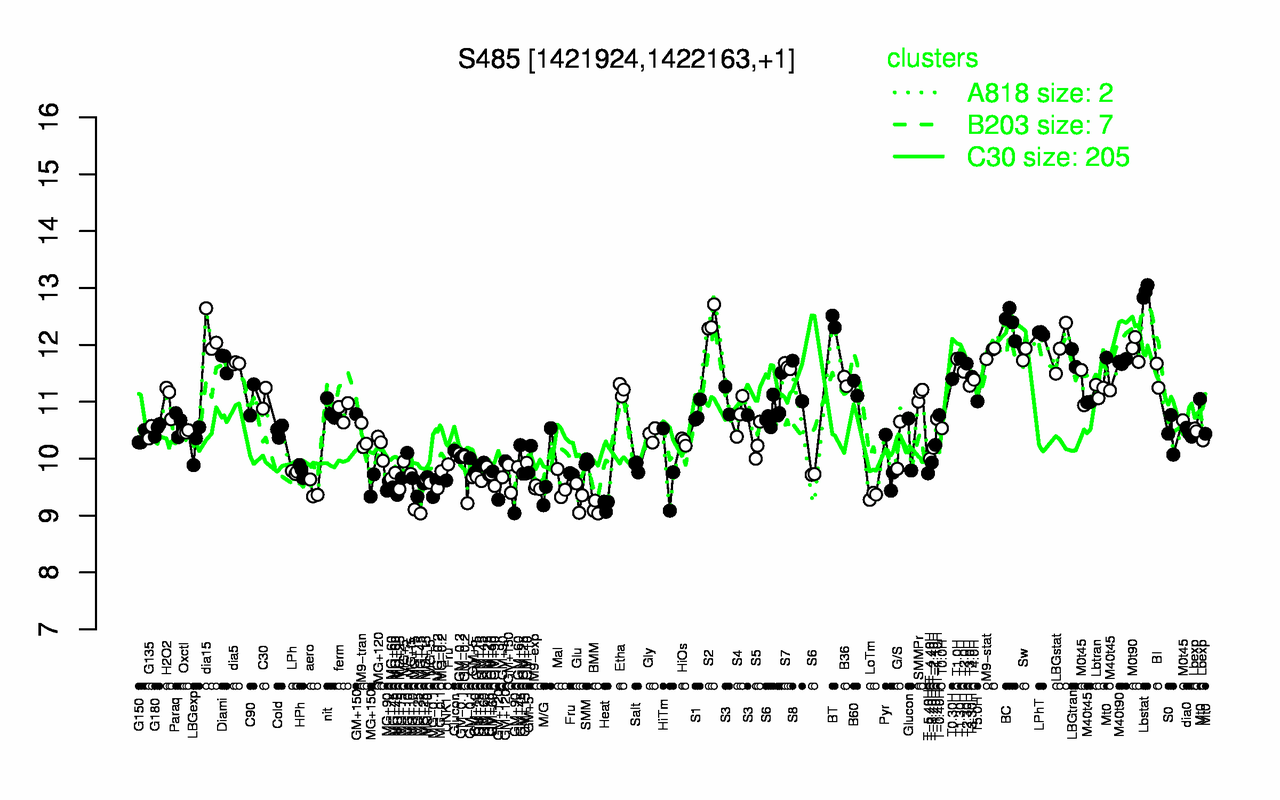
| Lbstat | S2 | BT | BC | LPhT | dia15 | LBGstat | M0t90 | M9-stat | Sw |
| 12.9 | 12.4 | 12.4 | 12.4 | 12.2 | 12.2 | 11.9 | 11.9 | 11.9 | 11.8 |
| BMM | Heat | MG+45 | Glu | LoTm | GM+90 | aero | MG+25 | MG+15 | M9-exp |
| 9.13 | 9.18 | 9.3 | 9.32 | 9.35 | 9.41 | 9.45 | 9.45 | 9.47 | 9.49 |