| Start Page |
|
 |
| Start Page |
|
|
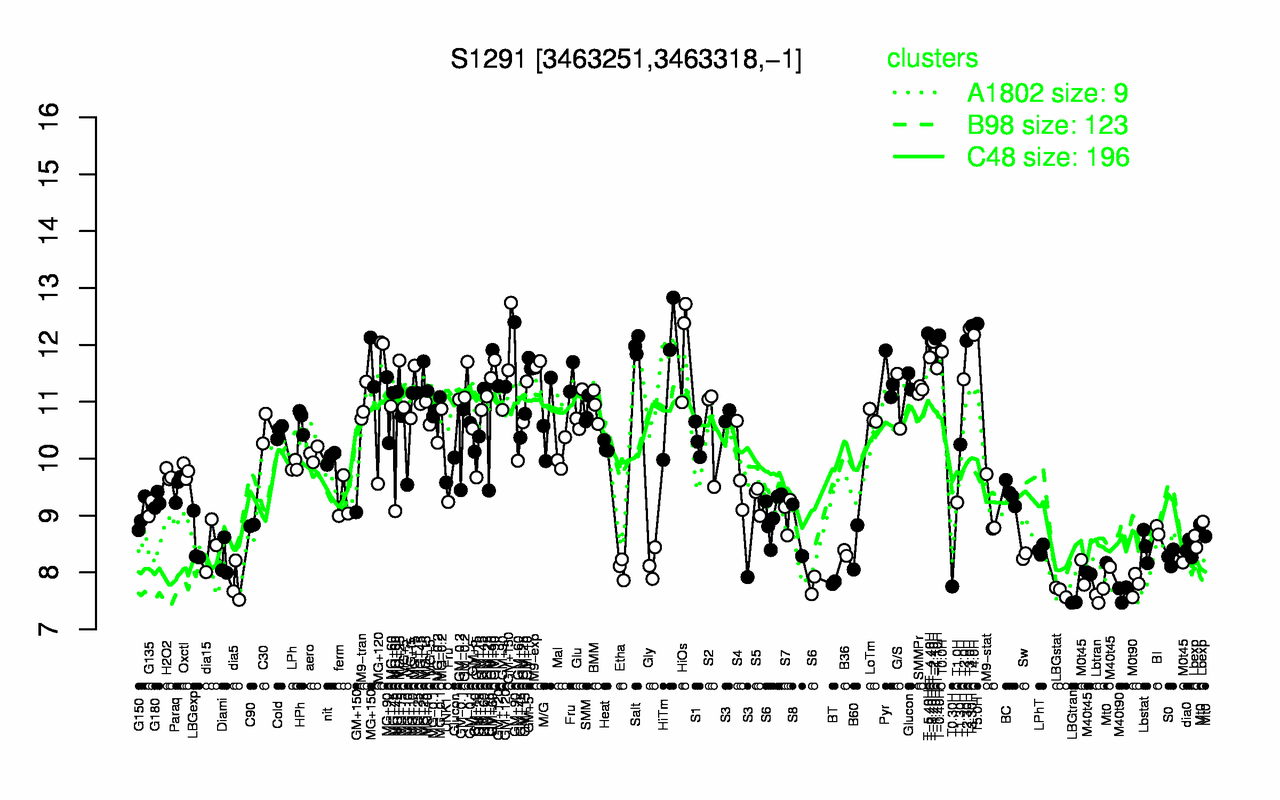
| T5.0H | T3.30H | T3.0H | T-5.40H | T4.0H | T-0.40H | T-1.40H | T2.30H | T-3.40H | T-2.40H |
| 12.4 | 12.3 | 12.3 | 12.2 | 12.2 | 12.2 | 12.1 | 12.1 | 12.1 | 12.1 |
| LBGtran | Lbtran | M40t90 | LBGstat | T0.30H | M0t90 | dia5 | BT | M40t45 | M0t45 |
| 7.47 | 7.59 | 7.64 | 7.67 | 7.75 | 7.78 | 7.8 | 7.82 | 8.02 | 8.06 |