| Start Page |
|
 |
| Start Page |
|
|
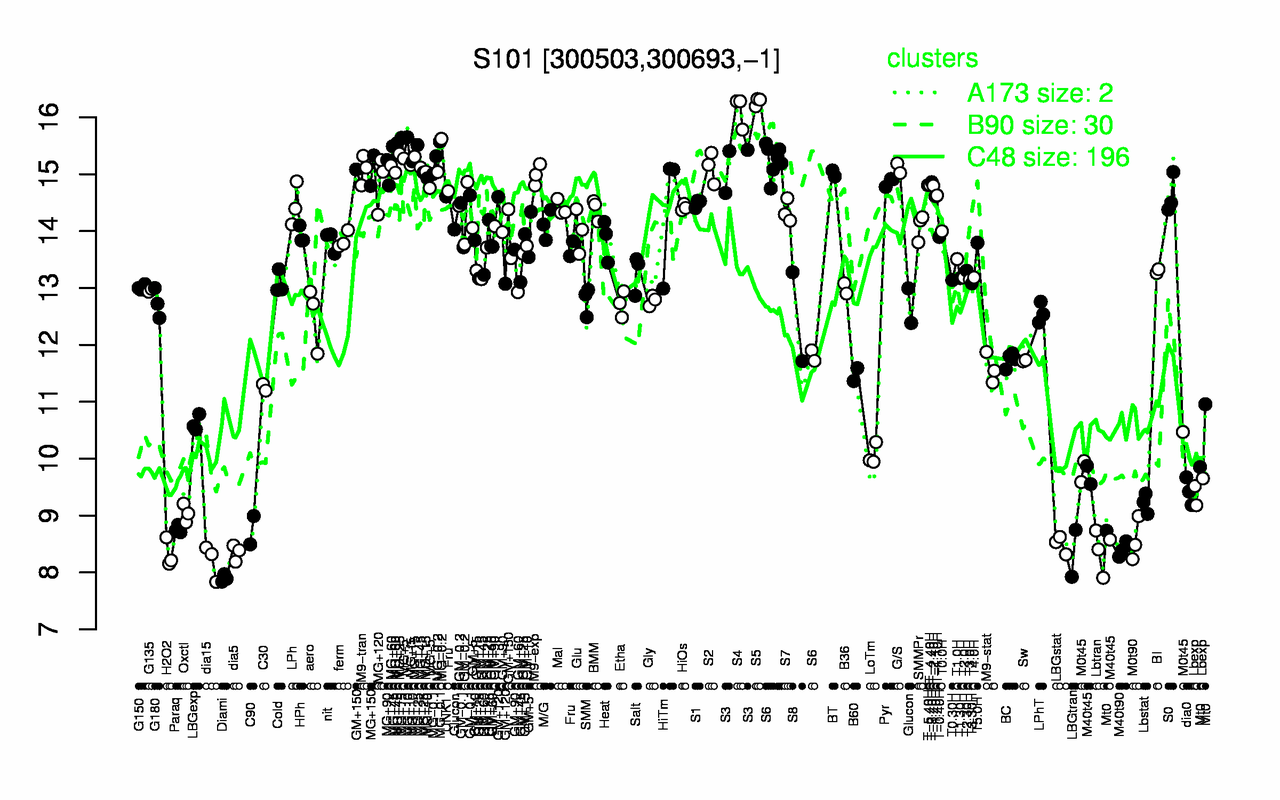
| S5 | S4 | MG+45 | MG+15 | MG-0.2 | MG+25 | MG-0.1 | MG+10 | S3 | MG+t5 |
| 16.3 | 16.1 | 15.4 | 15.3 | 15.3 | 15.3 | 15.3 | 15.3 | 15.2 | 15.2 |
| Diami | dia15 | H2O2 | LBGtran | Lbtran | dia5 | M40t90 | LBGstat | M0t90 | C90 |
| 7.9 | 8.2 | 8.33 | 8.34 | 8.35 | 8.35 | 8.4 | 8.49 | 8.57 | 8.74 |