| Start Page |
|
 |
| Start Page |
|
|
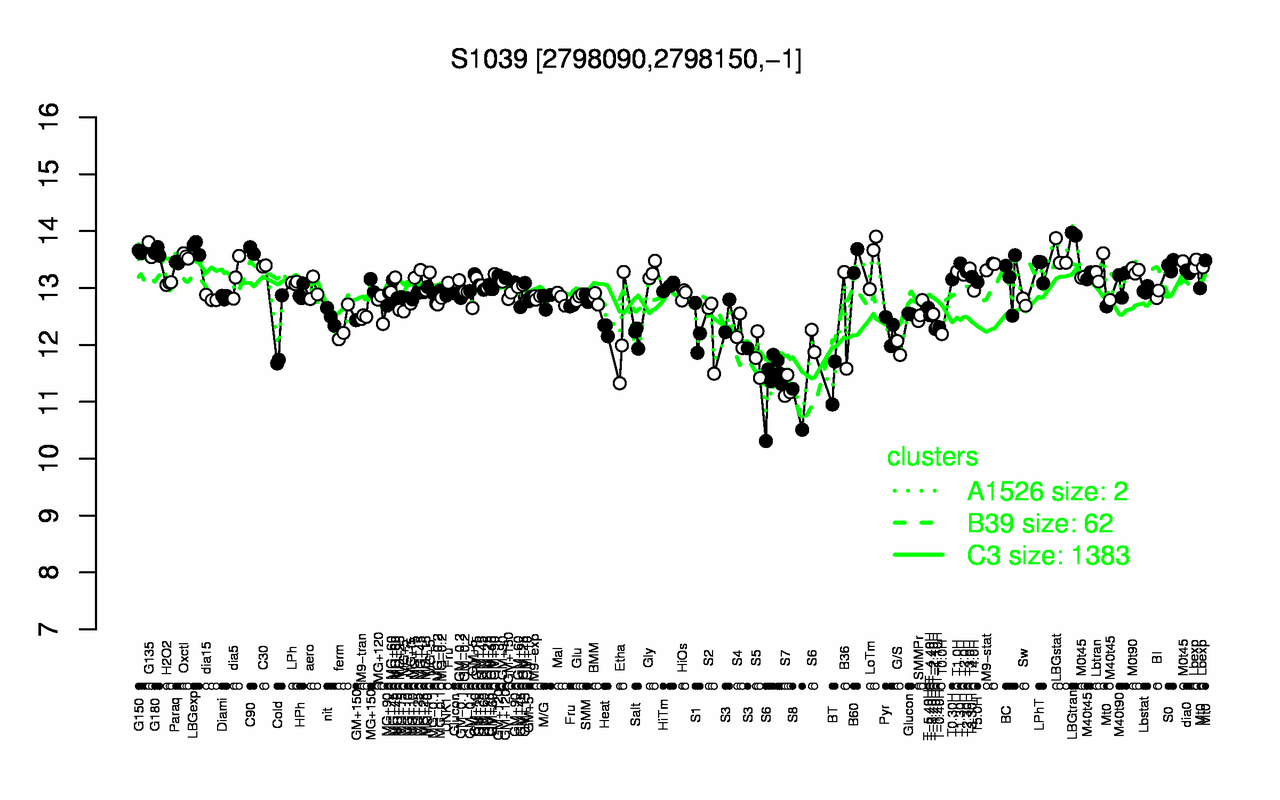
| LBGtran | LBGexp | G135 | C90 | G150 | G180 | LBGstat | Oxctl | LoTm | B60 |
| 13.9 | 13.7 | 13.7 | 13.7 | 13.6 | 13.6 | 13.6 | 13.6 | 13.5 | 13.5 |
| S8 | S7 | BT | S6 | S5 | G/S | Cold | Salt | T0.0H | Etha |
| 10.9 | 11.2 | 11.3 | 11.5 | 11.8 | 11.9 | 12.1 | 12.2 | 12.2 | 12.2 |