B. subtilis Expression Data Browser
Details about S1059 Show/Hide
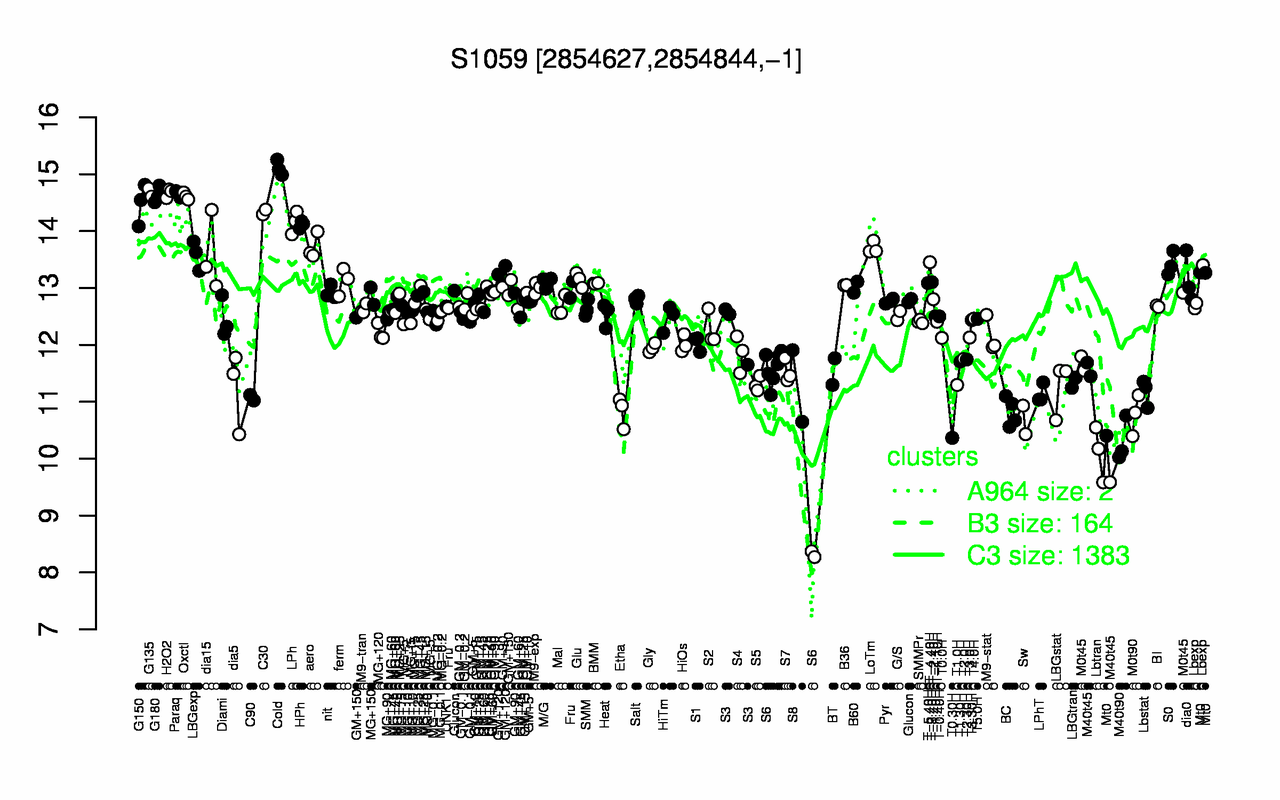
Highest Expression Conditions
Cold G135 H2O2 Paraq G180 Oxctl G150 C30 LPh HPh
15.1 14.7 14.7 14.7 14.6 14.6 14.5 14.3 14.2 14.1
Lowest Expression Conditions
Lbtran M40t90 T0.30H Sw M0t90 BC Etha S6 M40t45 C90
10.1 10.3 10.4 10.7 10.8 10.8 10.8 10.9 10.9 11.1
Most Positively Correlated Segments
S1581 rnpA nusG S1580 S48 ybxA nusA ylxS bipA S595
0.87 0.87 0.85 0.85 0.85 0.83 0.83 0.83 0.82 0.82
Most Negatively Correlated Segments
S1151 ytzE yugM yqaC phoP phrG yisT ylbP phoR S1097
-0.73 -0.73 -0.72 -0.72 -0.7 -0.7 -0.69 -0.69 -0.69 -0.68
Expression Profile of Segment S1059 Show/Hide
Genomic View of Gene/Segment S1059 Show/Hide
(Legend)