| Start Page |
|
 |
| Start Page |
|
|
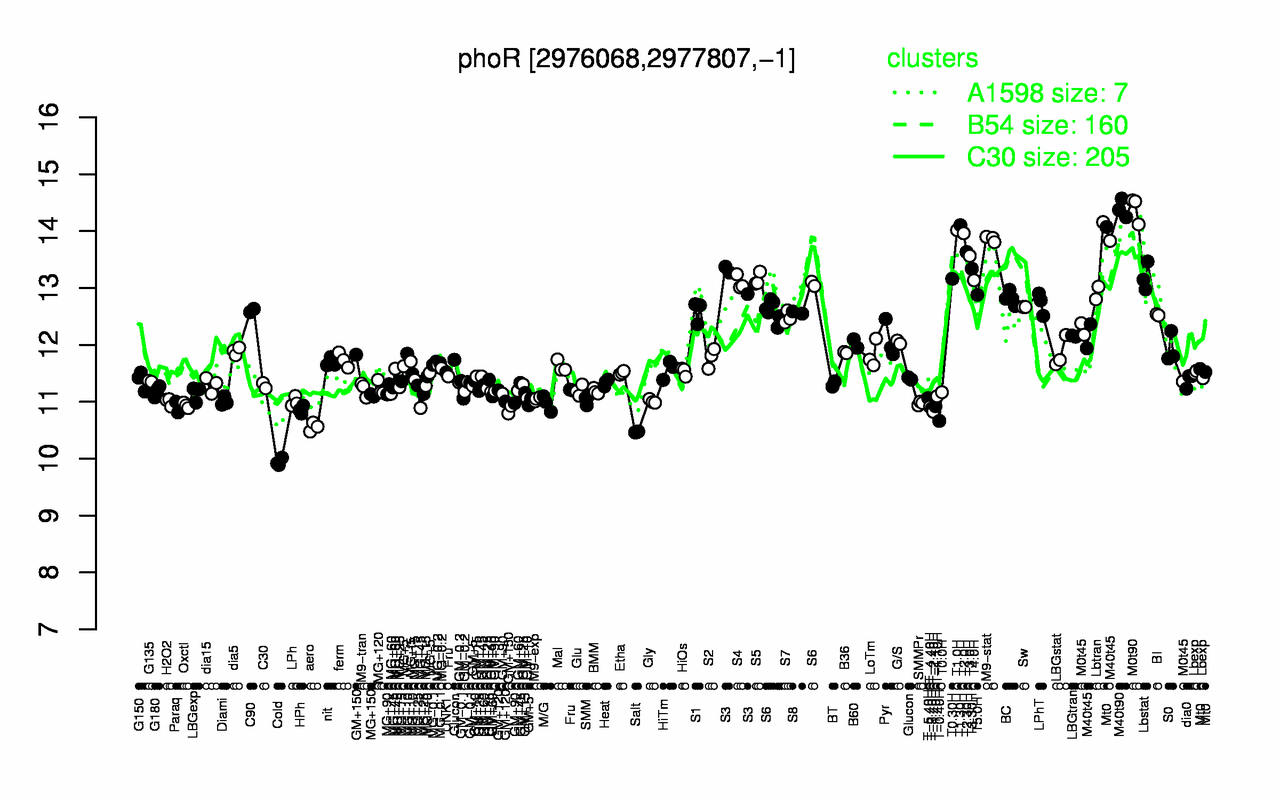
| M40t90 | M0t90 | T1.30H | T1.0H | T2.0H | M9-stat | T2.30H | T3.0H | T3.30H | Lbtran |
| 14.4 | 14.4 | 14.1 | 14 | 14 | 13.9 | 13.6 | 13.6 | 13.3 | 13.3 |
| Cold | Salt | aero | T-0.40H | T-2.40H | HPh | T-3.40H | T-4.40H | T-1.40H | Paraq |
| 9.94 | 10.5 | 10.6 | 10.7 | 10.8 | 10.9 | 10.9 | 10.9 | 10.9 | 10.9 |