| Start Page |
|
 |
| Start Page |
|
|
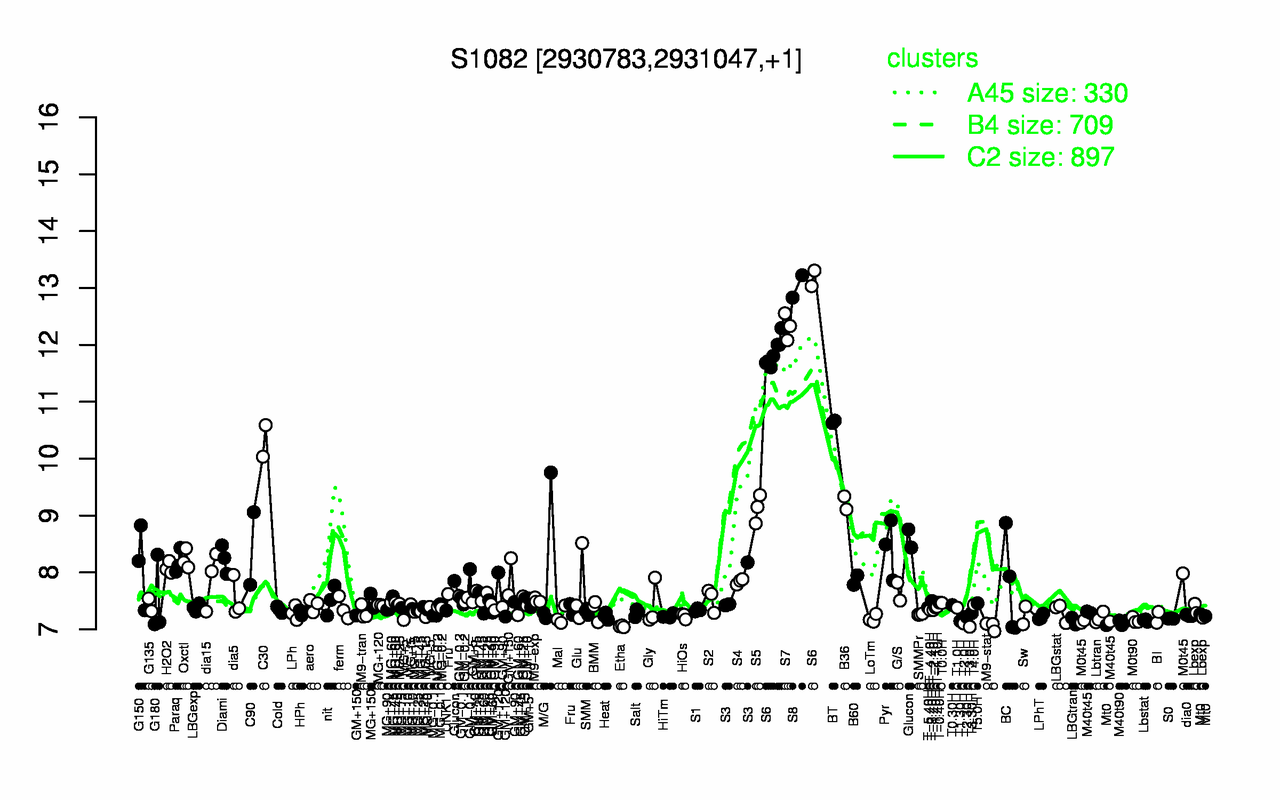
| S8 | S7 | S6 | BT | C30 | B36 | S5 | Pyr | C90 | Glucon |
| 13 | 12.3 | 12.2 | 10.6 | 10.3 | 9.22 | 9.12 | 8.42 | 8.42 | 8.35 |
| T3.0H | M9-stat | Etha | T2.0H | M40t90 | LBGtran | T1.30H | Lbstat | M0t90 | LoTm |
| 7.04 | 7.05 | 7.05 | 7.11 | 7.13 | 7.14 | 7.14 | 7.16 | 7.16 | 7.19 |