| Start Page |
|
 |
| Start Page |
|
|
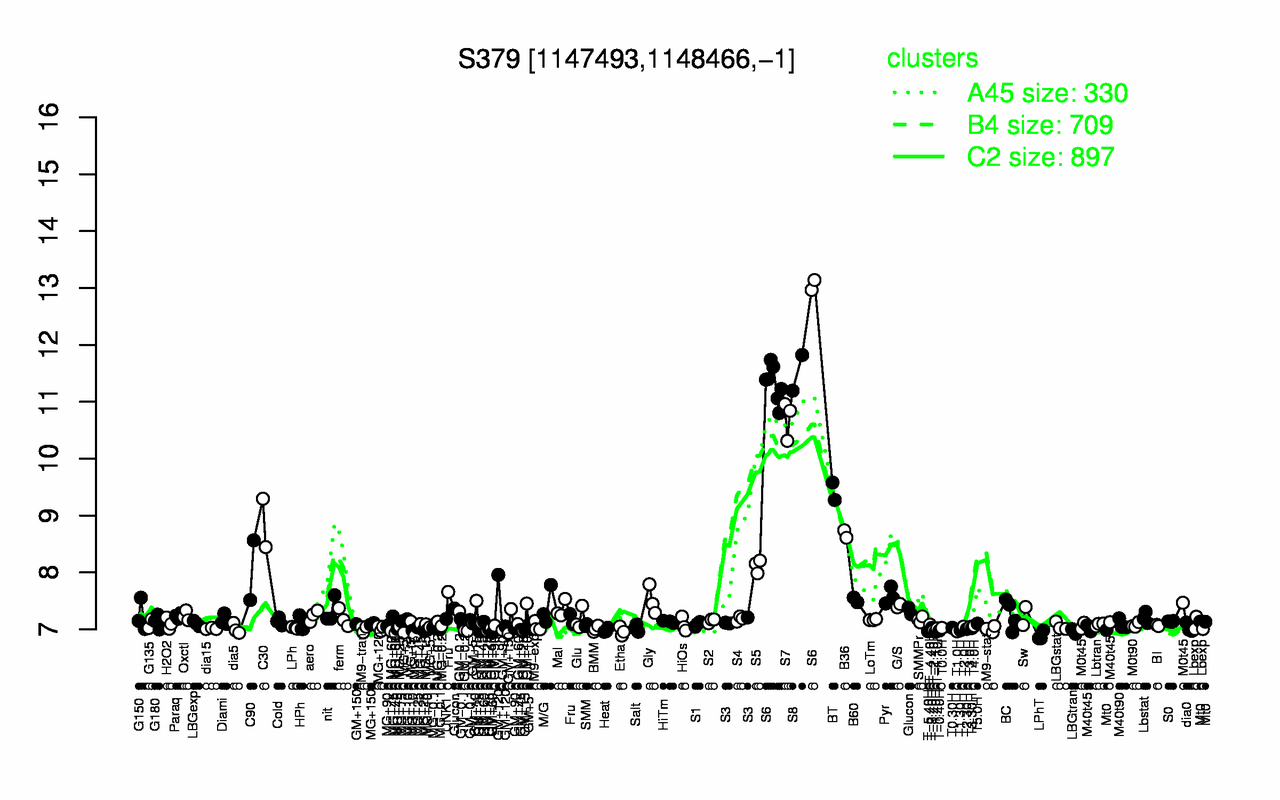
| S6 | S8 | S7 | BT | C30 | B36 | S5 | C90 | Pyr | B60 |
| 11.7 | 11.5 | 10.7 | 9.43 | 8.87 | 8.68 | 8.12 | 8.04 | 7.59 | 7.52 |
| LPhT | MG+60 | T-1.40H | LBGtran | T-5.40H | T1.0H | Etha | GM+25 | T-2.40H | T-0.40H |
| 6.89 | 6.95 | 6.96 | 6.96 | 6.97 | 6.97 | 6.97 | 6.98 | 6.98 | 6.98 |