B. subtilis Expression Data Browser
Details about S49 Show/Hide
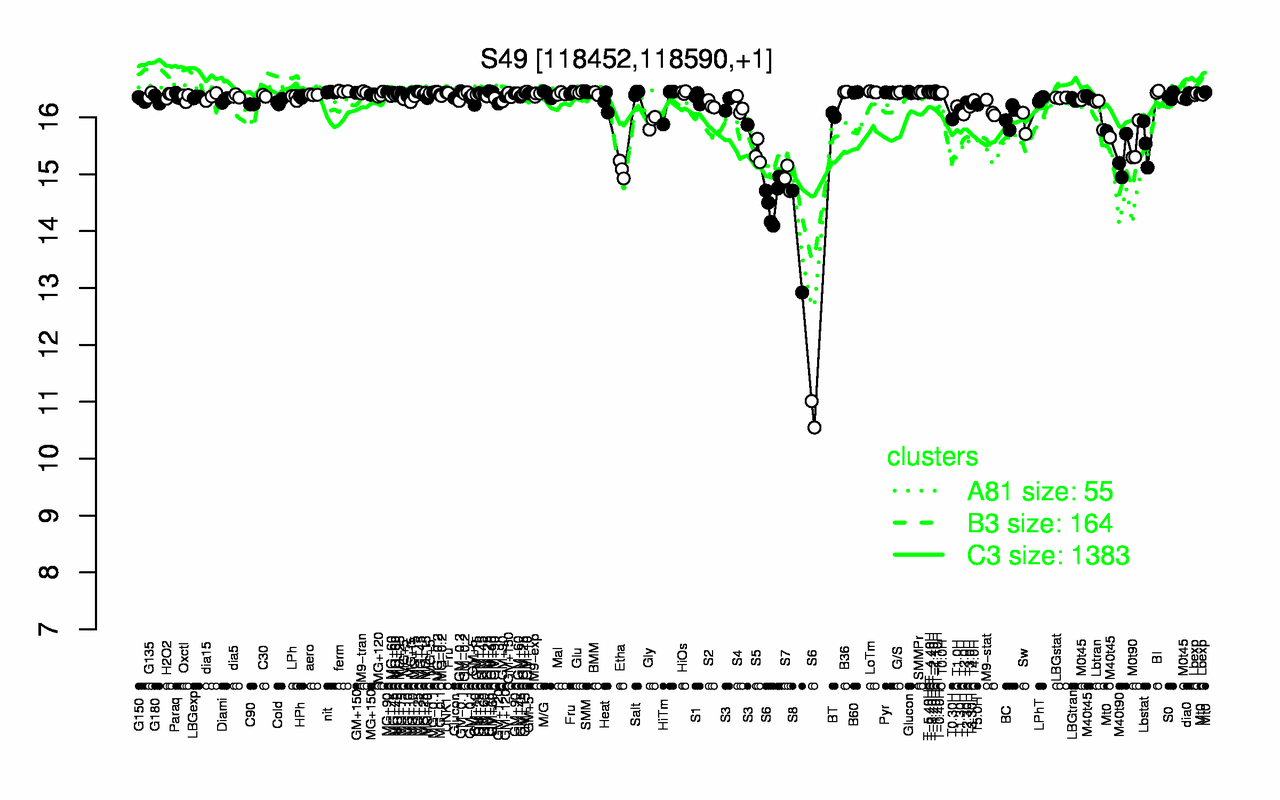
Highest Expression Conditions
T-1.40H ferm T-3.40H T-5.40H BI B36 LoTm SMM T-2.40H nit
16.5 16.5 16.5 16.5 16.4 16.4 16.4 16.4 16.4 16.4
Lowest Expression Conditions
S6 S8 S7 Etha M40t90 S5 M0t90 Lbstat Sw Gly
13.7 13.8 14.9 15.1 15.3 15.4 15.5 15.5 15.9 15.9
Most Positively Correlated Segments
rplK NA fusA rpsG rplGB S53 rpsL rplA rplM S50
0.98 0.95 0.91 0.91 0.91 0.9 0.89 0.89 0.88 0.87
Most Negatively Correlated Segments
ynzE S1054 yteT yoaM ywbA yteS S1237 S379 S1191 S400
-0.87 -0.83 -0.83 -0.81 -0.81 -0.81 -0.81 -0.8 -0.8 -0.8
Expression Profile of Segment S49 Show/Hide
Genomic View of Gene/Segment S49 Show/Hide
(Legend)