| Start Page |
|
 |
| Start Page |
|
|
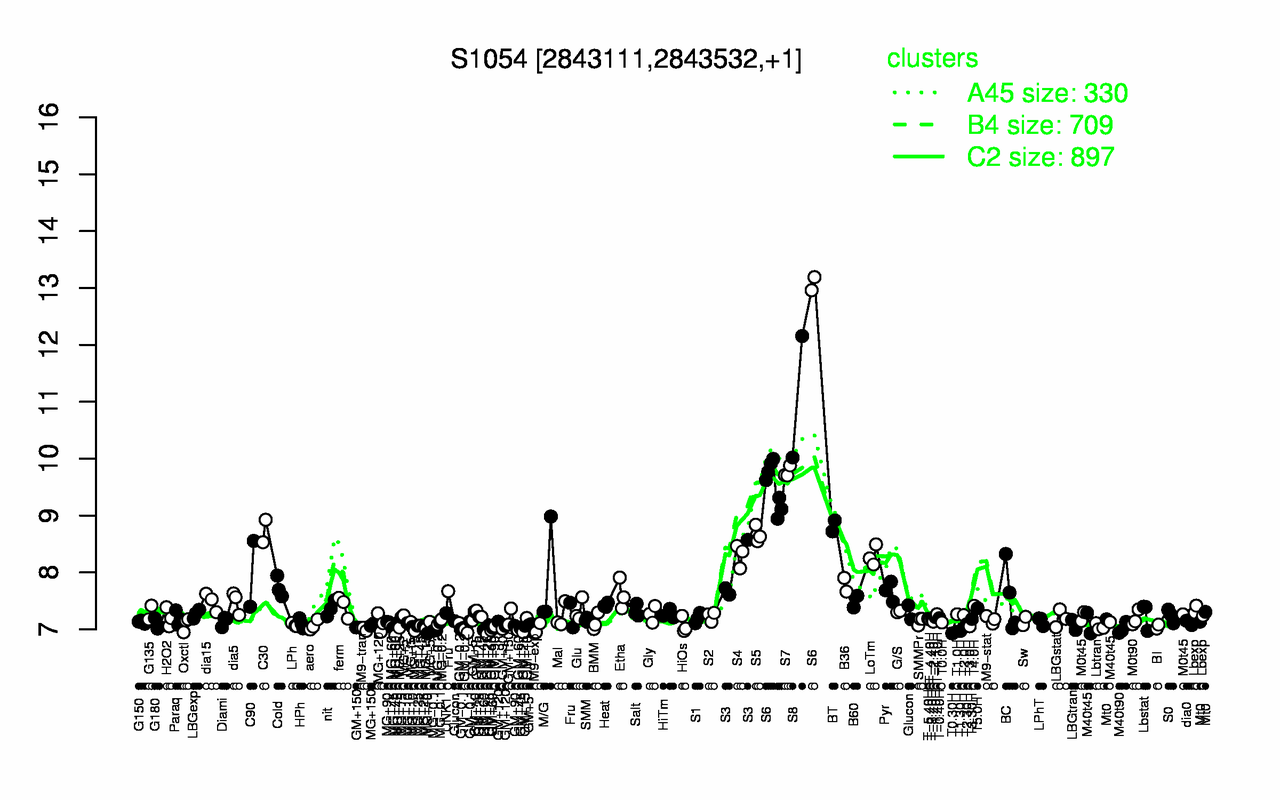
| S8 | S6 | S7 | BT | C30 | S5 | S4 | LoTm | C90 | S3 |
| 11.1 | 10.3 | 9.76 | 8.82 | 8.73 | 8.67 | 8.3 | 8.29 | 7.98 | 7.97 |
| T0.30H | T1.30H | MG+60 | GM+60 | M9-exp | M9-tran | GM-0.2 | M40t90 | MG-0.1 | MG+10 |
| 6.93 | 6.97 | 6.97 | 7 | 7 | 7.01 | 7.02 | 7.02 | 7.03 | 7.03 |