| Start Page |
|
 |
| Start Page |
|
|
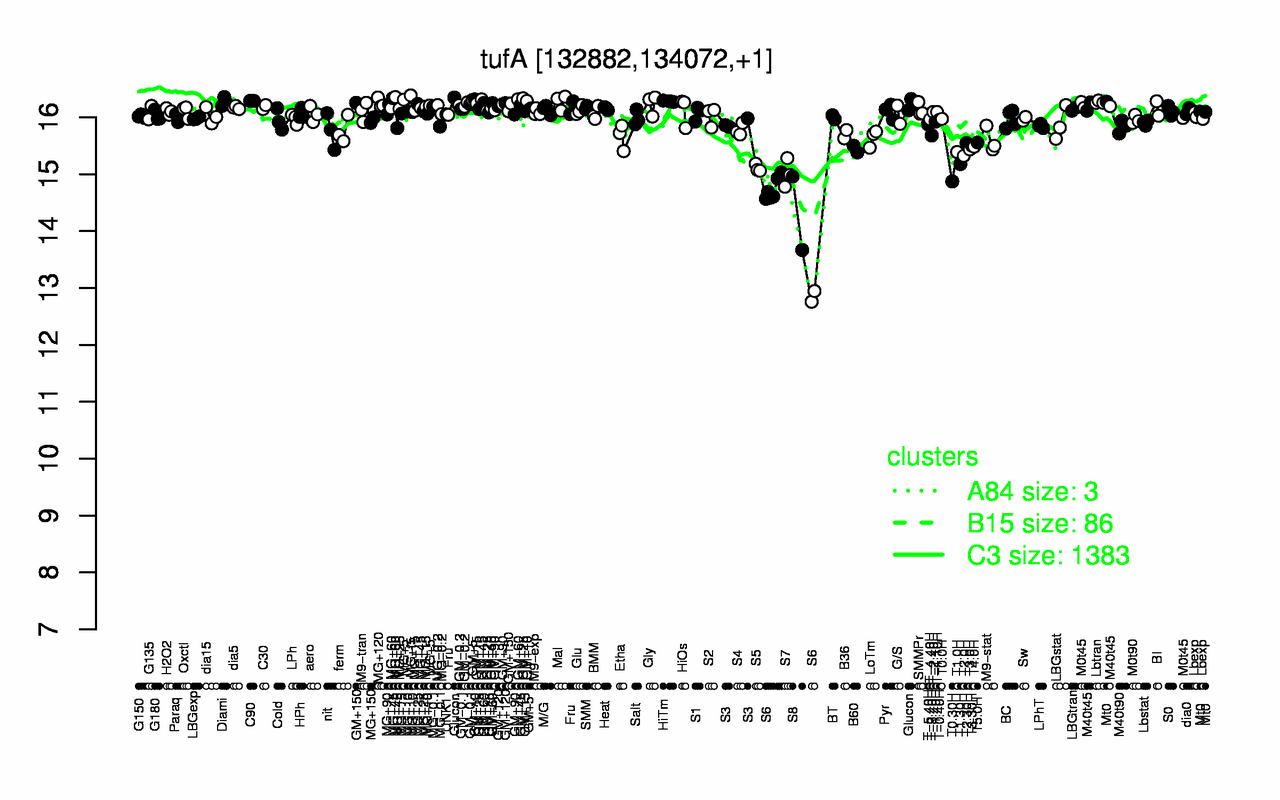
| MG+t5 | GM+10 | C90 | HiTm | GM+60 | Mal | Lbtran | Diami | Glucon | MG+5 |
| 16.4 | 16.3 | 16.3 | 16.3 | 16.3 | 16.3 | 16.3 | 16.3 | 16.3 | 16.3 |
| S8 | S6 | T0.30H | S7 | S5 | T1.30H | T2.0H | T1.0H | T3.0H | B60 |
| 14.3 | 14.3 | 14.9 | 15 | 15.1 | 15.2 | 15.3 | 15.4 | 15.4 | 15.4 |