| Start Page |
|
 |
| Start Page |
|
|
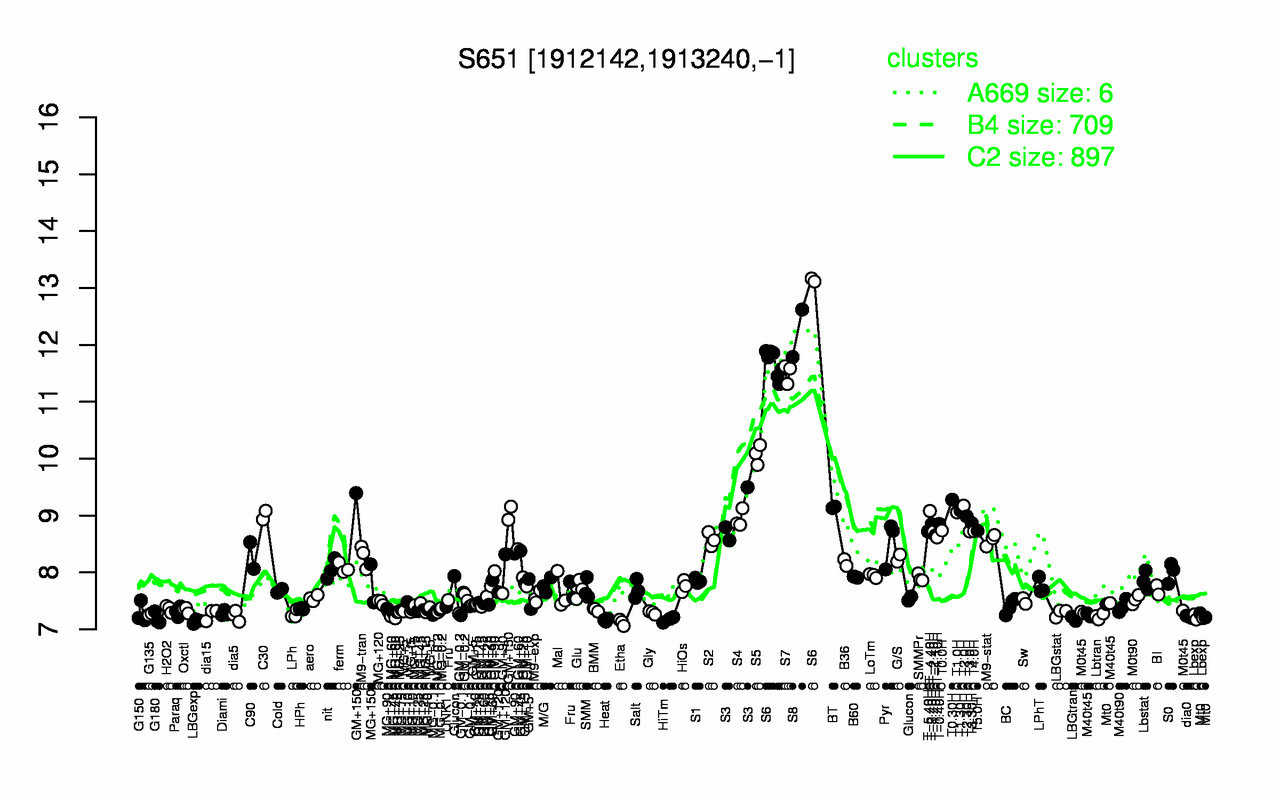
| S8 | S6 | S7 | S5 | T0.30H | T2.0H | GM+150 | BT | T1.30H | T-4.40H |
| 12.2 | 12 | 11.5 | 10.1 | 9.28 | 9.17 | 9.16 | 9.14 | 9.08 | 9.08 |
| Etha | LBGexp | Heat | HiTm | LBGtran | G180 | Lbexp | MG+60 | dia0 | Lbtran |
| 7.12 | 7.14 | 7.16 | 7.17 | 7.19 | 7.19 | 7.21 | 7.21 | 7.22 | 7.23 |