B. subtilis Expression Data Browser
Start Page
B. subtilis Expression Data Browser
Gene/Segment:
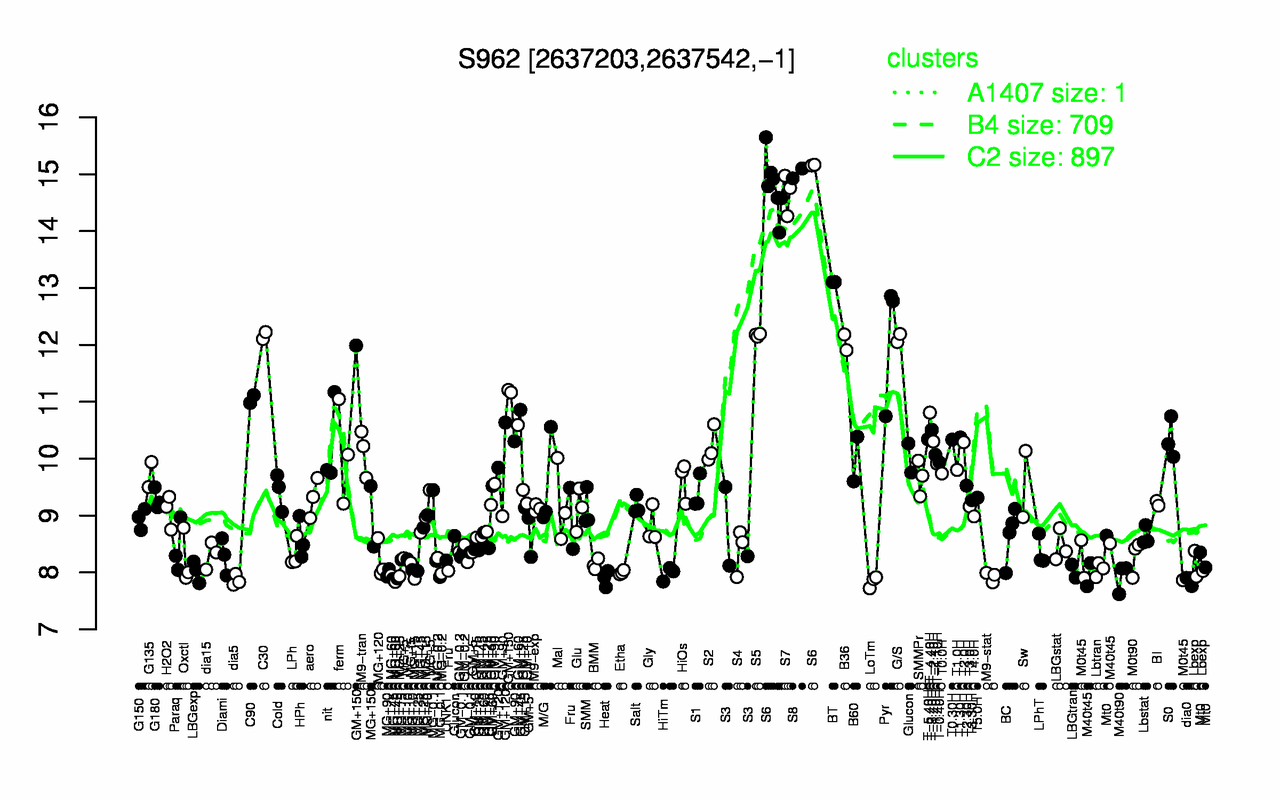
S962
Locus Tag:
new_2637203_2637542_c
Details about S962
Show/Hide
Highest Expression Conditions
S8
S6
S7
BT
S5
C30
Pyr
G/S
B36
GM+150
15
14.9
14.7
13.1
12.2
12.2
12.1
12.1
12
11.5
Lowest Expression Conditions
LoTm
dia0
dia5
MG+60
Heat
M40t90
M9-stat
HiTm
MG+90
Etha
7.84
7.86
7.86
7.89
7.89
7.92
7.93
7.98
7.99
8
Most Positively Correlated Segments
S651
ypqA
S195
cdoA
yodH
yoaI
ydgB
ytcC
S1034
ytcB
0.88
0.87
0.86
0.86
0.86
0.86
0.86
0.86
0.86
0.85
Most Negatively Correlated Segments
yusH
S1189
moeB
yviA
rsbS
gtaB
yulF
yunF
lipA
dnaB
-0.77
-0.76
-0.75
-0.75
-0.75
-0.74
-0.74
-0.74
-0.74
-0.74
Expression Profile of Segment S962
Show/Hide
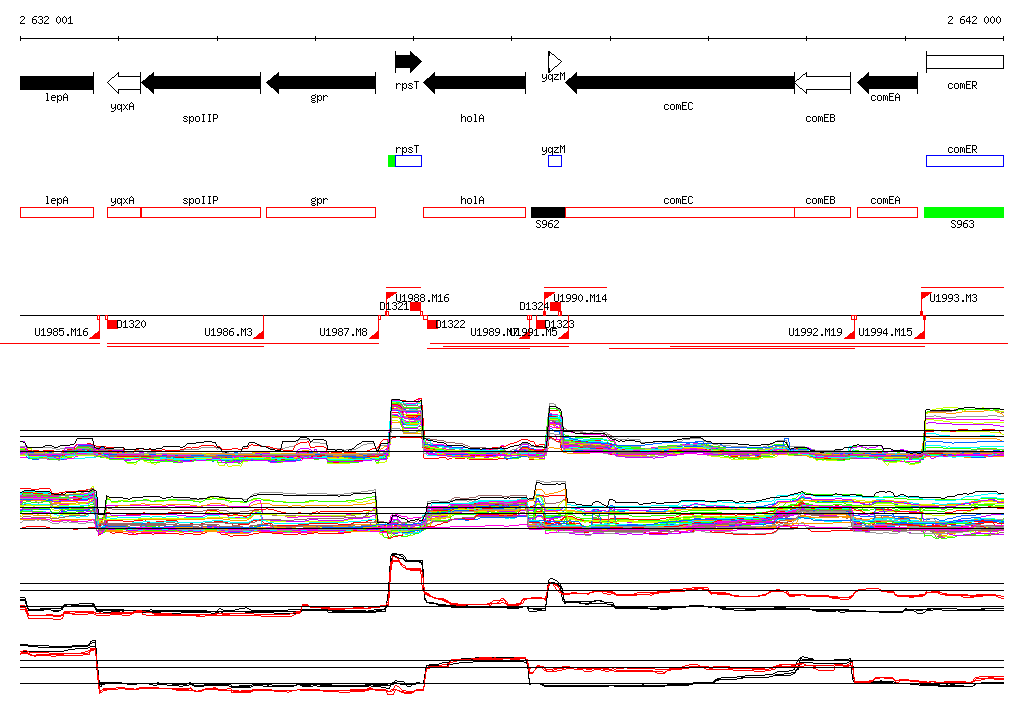
Genomic View of Gene/Segment S962
Show/Hide
(Legend)
Browse Genome Context