| Start Page |
|
 |
| Start Page |
|
|
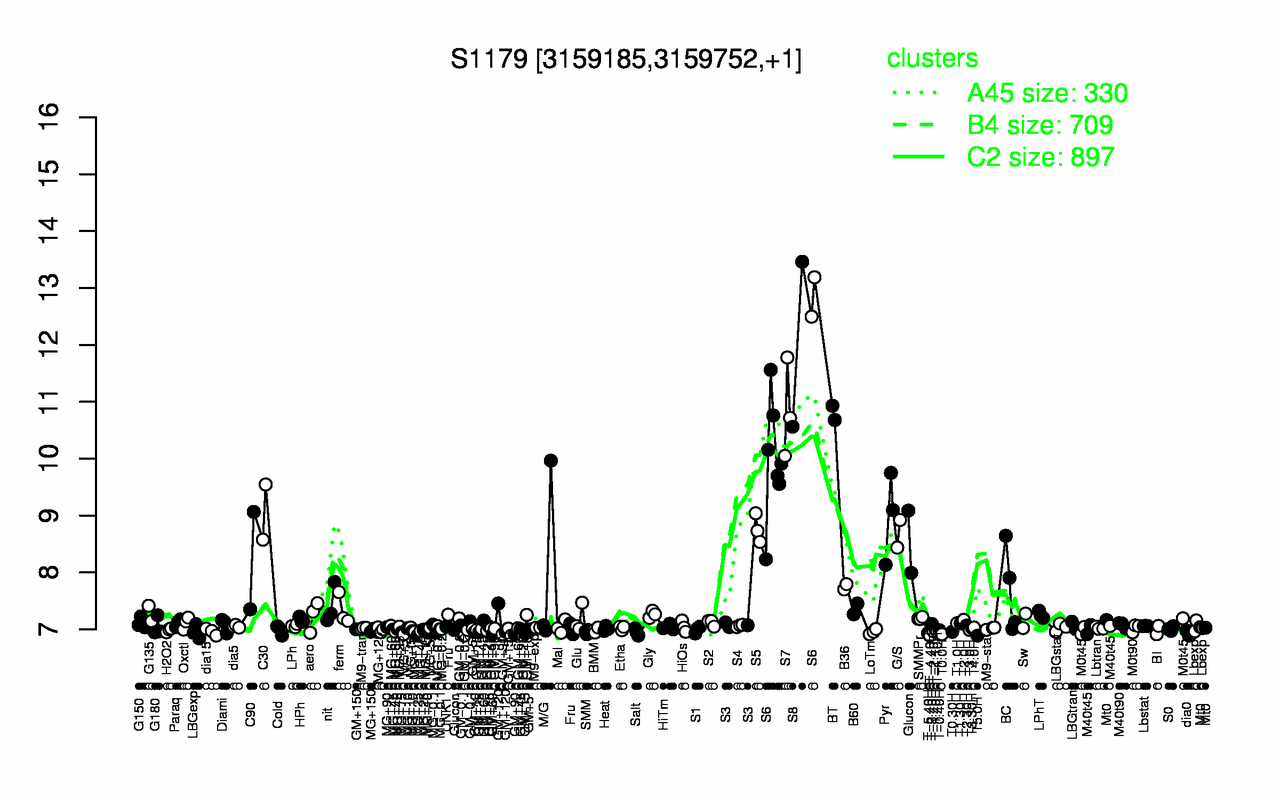
| S8 | S7 | BT | S6 | C30 | Pyr | S5 | G/S | C90 | Glucon |
| 12 | 10.8 | 10.8 | 10.6 | 9.06 | 8.99 | 8.77 | 8.68 | 8.21 | 8.02 |
| T5.0H | T-4.40H | T0.0H | MG+15 | T-5.40H | dia0 | GM+25 | GM+90 | Salt | SMM |
| 6.89 | 6.89 | 6.91 | 6.92 | 6.93 | 6.93 | 6.94 | 6.95 | 6.95 | 6.96 |