B. subtilis Expression Data Browser
Start Page
B. subtilis Expression Data Browser
Gene/Segment:
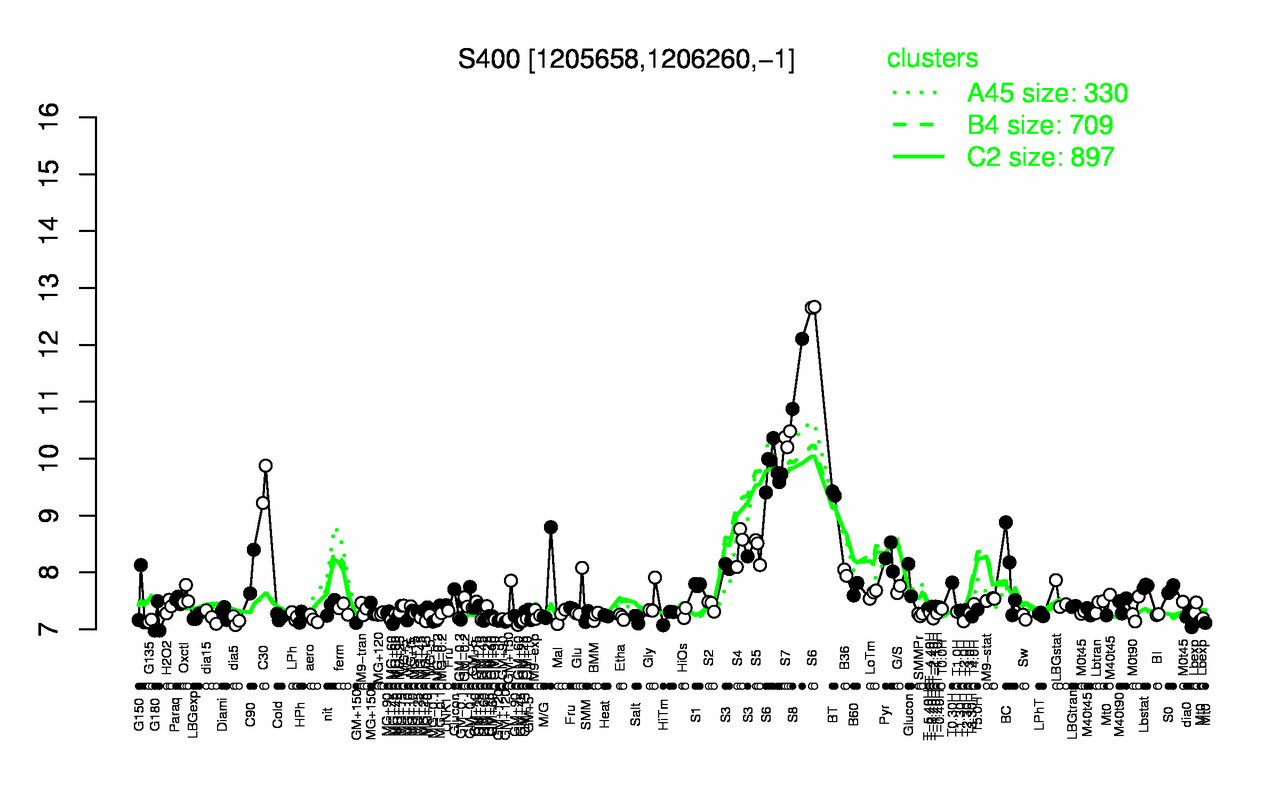
S400
Locus Tag:
new_1205658_1206260_c
Details about S400
Show/Hide
Highest Expression Conditions
S8
S6
S7
C30
BT
S4
S5
Pyr
S3
C90
11.5
10.5
10.4
9.55
9.39
8.48
8.4
8.26
8.16
8.02
Lowest Expression Conditions
T2.0H
GM+120
G135
G180
GM+60
dia5
GM+45
MG+45
Mt0
aero
7.14
7.14
7.15
7.15
7.15
7.15
7.16
7.17
7.17
7.19
Most Positively Correlated Segments
S1180
S1054
S632
S1083
S1082
ynzE
S1191
S379
S1179
S349
0.95
0.94
0.94
0.94
0.93
0.92
0.92
0.92
0.92
0.92
Most Negatively Correlated Segments
S1439
yusH
S861
parA
S49
S511
rplK
ykuH
ptkA
rsbU
-0.82
-0.81
-0.81
-0.81
-0.8
-0.79
-0.78
-0.78
-0.78
-0.78
Expression Profile of Segment S400
Show/Hide
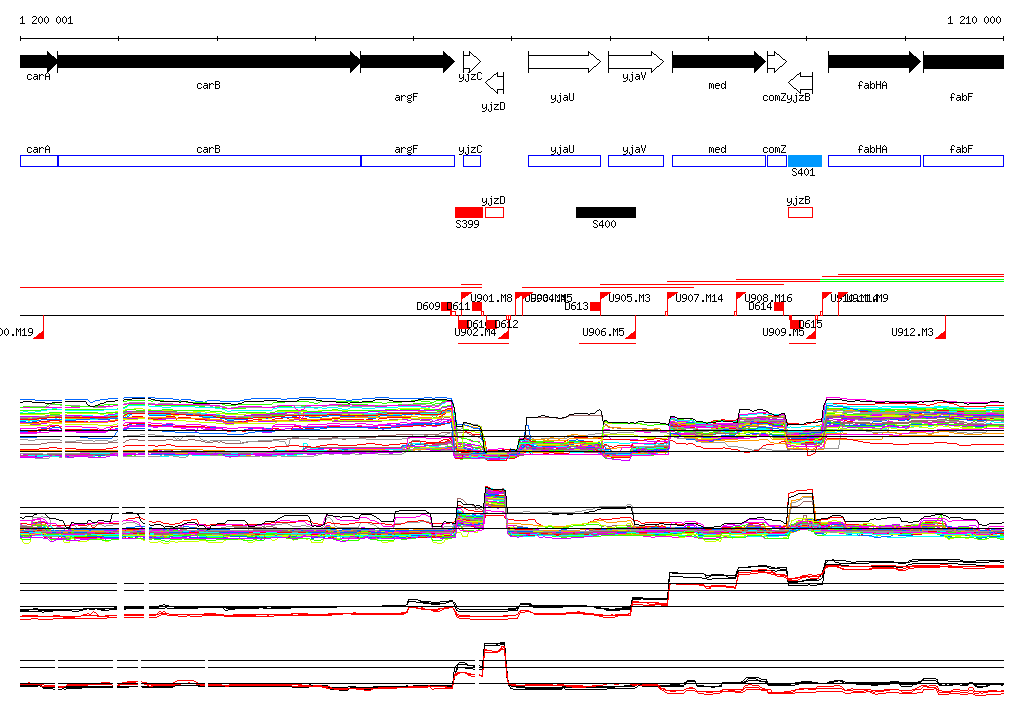
Genomic View of Gene/Segment S400
Show/Hide
(Legend)
Browse Genome Context