| Start Page |
|
 |
| Start Page |
|
|
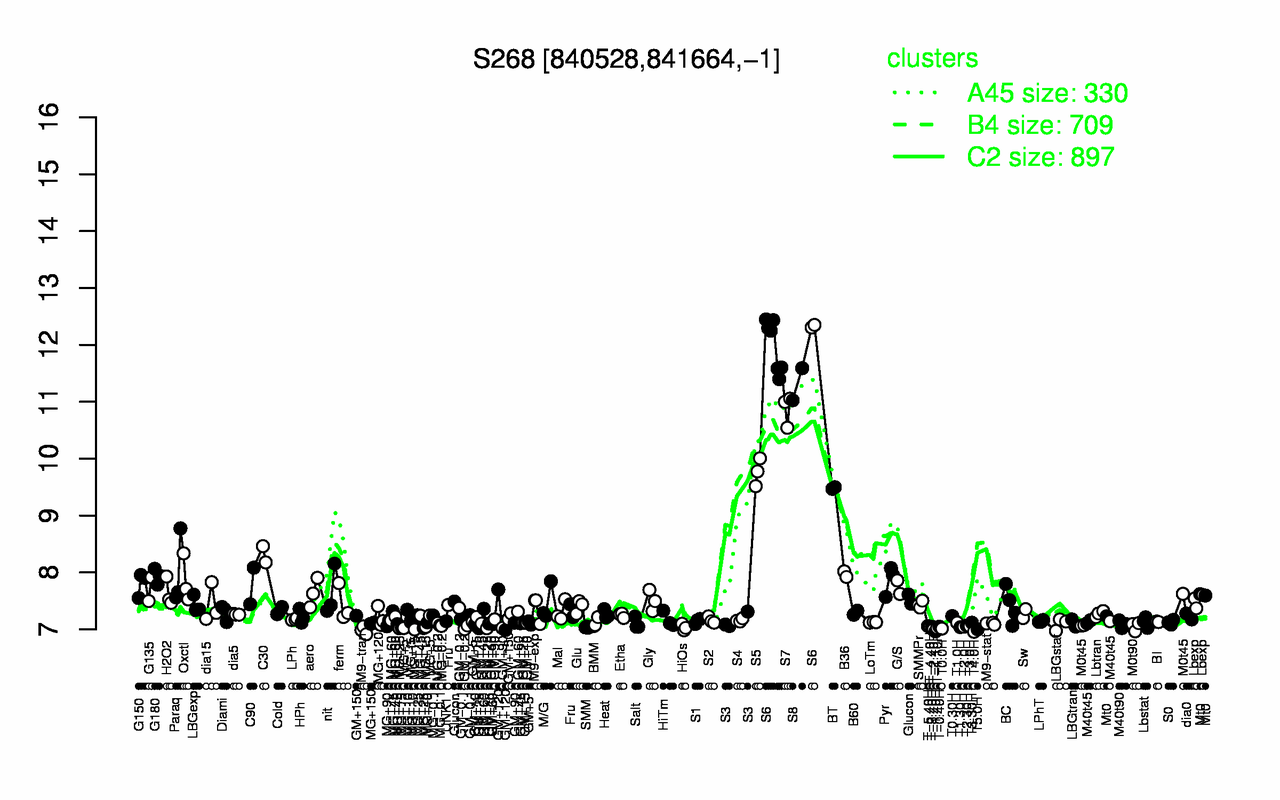
| S6 | S8 | S7 | S5 | BT | C30 | Paraq | B36 | G180 | Pyr |
| 12.1 | 11.3 | 10.9 | 9.77 | 9.48 | 8.32 | 8 | 7.97 | 7.93 | 7.87 |
| T4.0H | T-1.40H | M9-tran | T5.0H | T-2.40H | T0.0H | T-1.10H | MG+15 | HiOs | SMM |
| 6.96 | 6.97 | 6.98 | 7 | 7 | 7.01 | 7.02 | 7.02 | 7.04 | 7.04 |