B. subtilis Expression Data Browser
Details about S607 Show/Hide
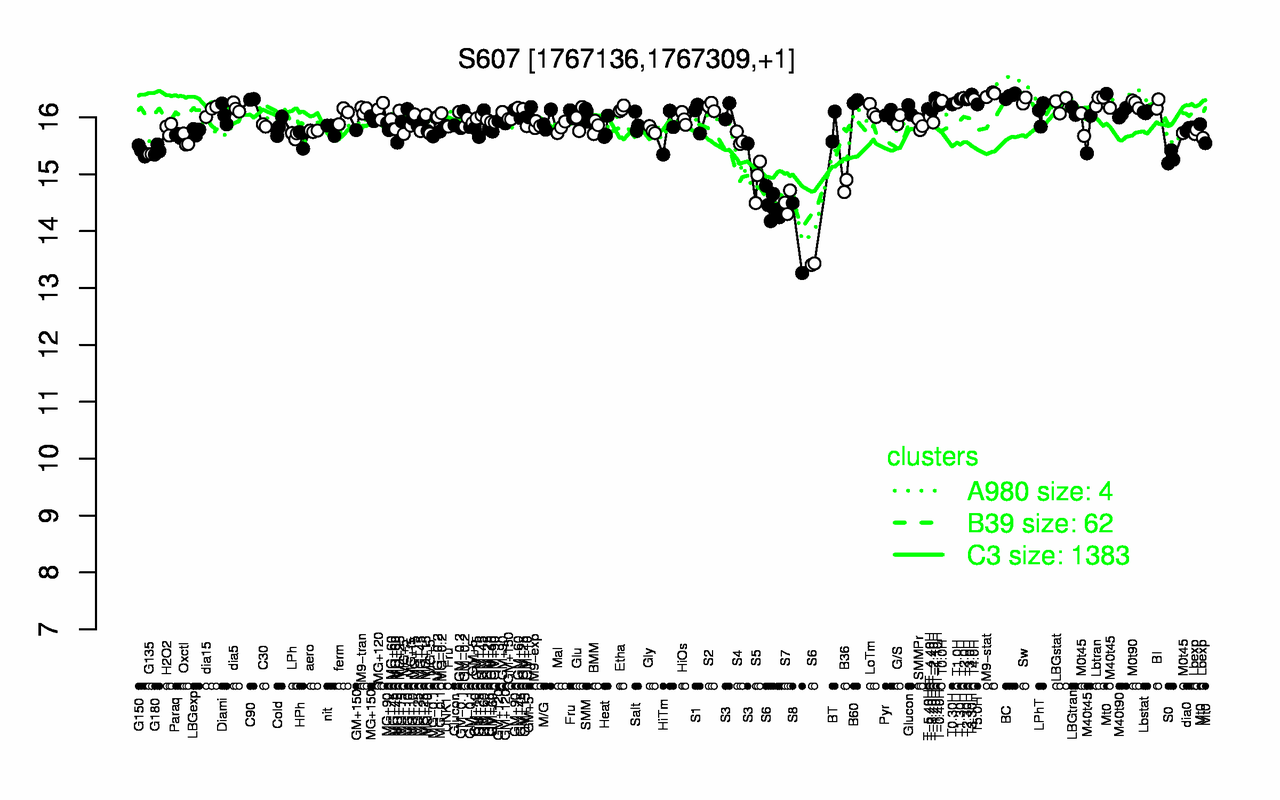
Highest Expression Conditions
M9-stat T3.30H BC T2.0H T3.0H T-1.40H T1.30H T2.30H T4.0H C90
16.4 16.4 16.4 16.3 16.3 16.3 16.3 16.3 16.3 16.3
Lowest Expression Conditions
S8 S6 S7 B36 S5 S0 G135 G150 G180 Oxctl
13.9 14.2 14.5 14.8 14.9 15.3 15.4 15.4 15.4 15.6
Most Positively Correlated Segments
ymdA ypjP yobK pksB yokI kinD sigH ypjQ degU aadK
0.84 0.81 0.8 0.79 0.79 0.78 0.78 0.78 0.77 0.77
Most Negatively Correlated Segments
S425 ywbA S268 S984 S1178 ylbE S1177 S1197 S1191 S1280
-0.84 -0.81 -0.81 -0.81 -0.8 -0.8 -0.8 -0.8 -0.8 -0.8
Expression Profile of Segment S607 Show/Hide
Genomic View of Gene/Segment S607 Show/Hide
(Legend)