| Start Page |
|
 |
| Start Page |
|
|
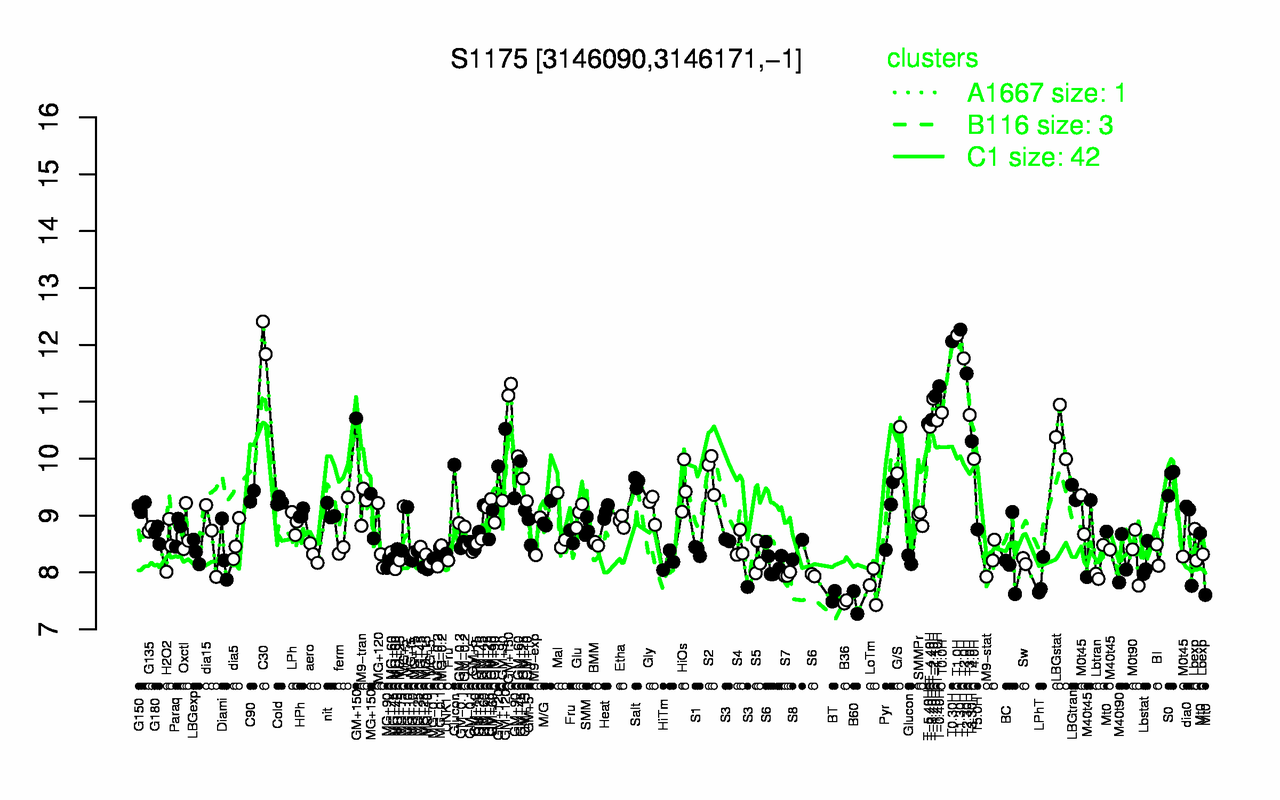
| T1.30H | T1.0H | C30 | T0.30H | T2.0H | T2.30H | T-0.40H | T-1.40H | T-2.40H | GM+150 |
| 12.3 | 12.2 | 12.1 | 12.1 | 11.8 | 11.5 | 11.3 | 11.1 | 11.1 | 11 |
| B60 | B36 | BT | LoTm | LPhT | S7 | Lbtran | S6 | MG+90 | M40t90 |
| 7.47 | 7.48 | 7.58 | 7.76 | 7.88 | 7.96 | 8.12 | 8.12 | 8.17 | 8.18 |