| Start Page |
|
 |
| Start Page |
|
|
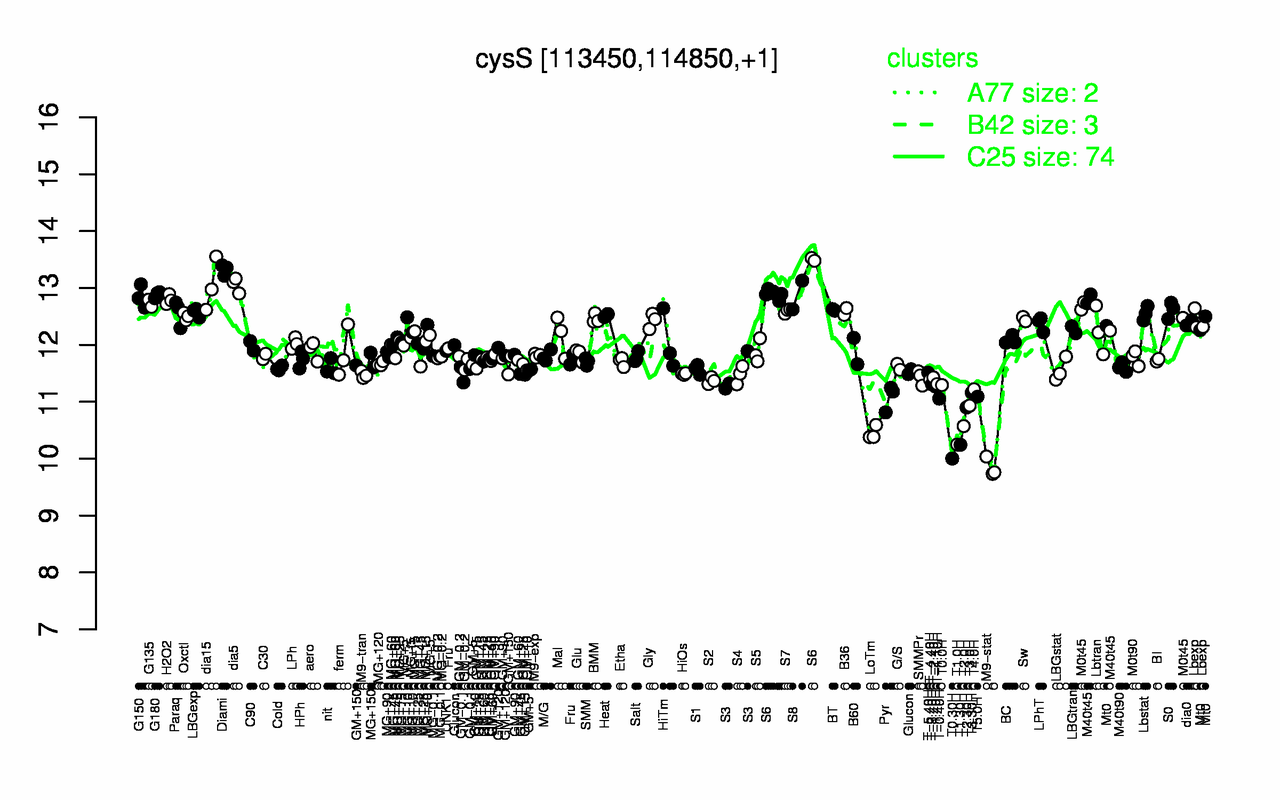
| Diami | dia5 | dia15 | S6 | G180 | S8 | G150 | H2O2 | G135 | M40t45 |
| 13.3 | 13.1 | 13 | 13 | 12.9 | 12.9 | 12.8 | 12.8 | 12.7 | 12.6 |
| M9-stat | T0.30H | T1.30H | T1.0H | LoTm | T2.0H | T2.30H | T3.0H | T-0.40H | Pyr |
| 9.84 | 10 | 10.2 | 10.2 | 10.5 | 10.6 | 10.9 | 10.9 | 11.1 | 11.1 |