| Start Page |
|
 |
| Start Page |
|
|
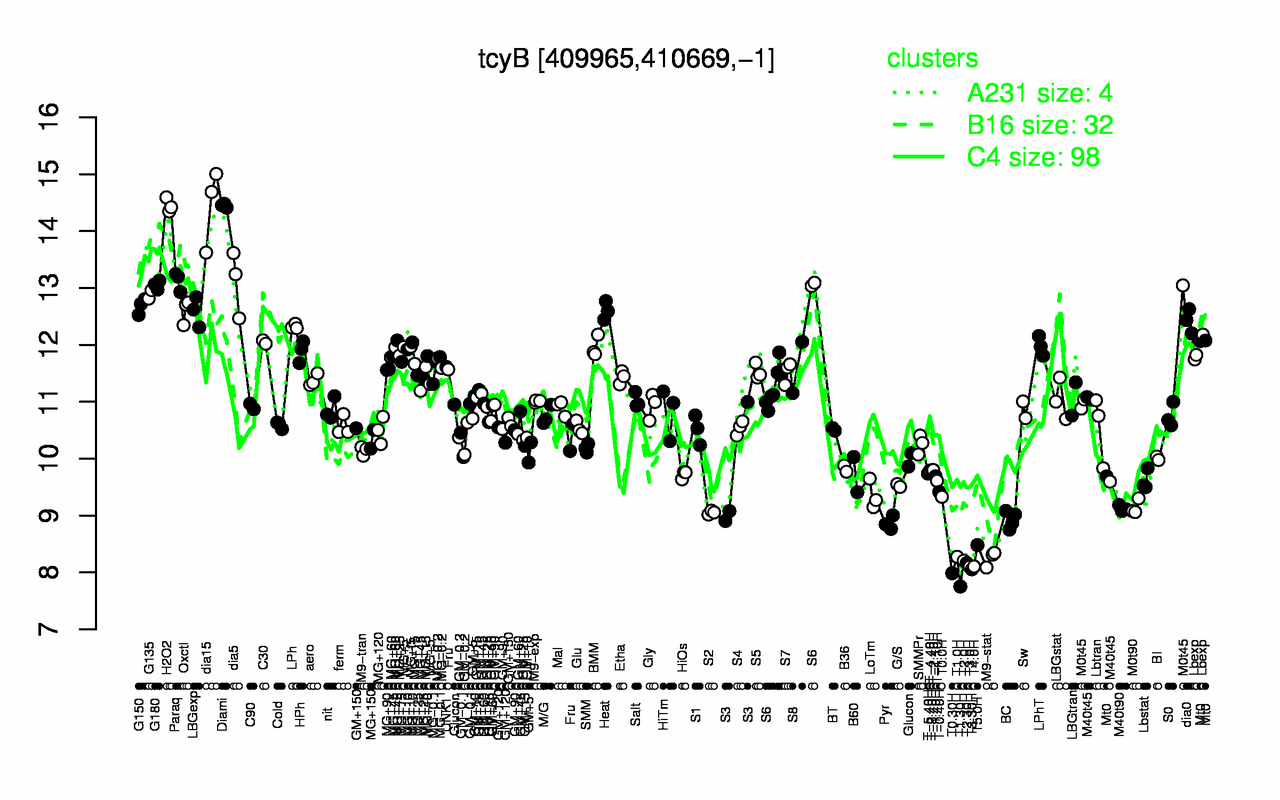
| H2O2 | Diami | dia15 | Paraq | dia5 | G180 | G135 | G150 | Heat | Oxctl |
| 14.5 | 14.4 | 14.4 | 13.1 | 13.1 | 13.1 | 12.9 | 12.7 | 12.6 | 12.6 |
| T1.30H | T0.30H | T3.30H | T3.0H | T4.0H | T2.30H | T2.0H | M9-stat | T1.0H | T5.0H |
| 7.75 | 7.99 | 8.06 | 8.1 | 8.1 | 8.17 | 8.21 | 8.25 | 8.28 | 8.48 |