| Start Page |
|
 |
| Start Page |
|
|
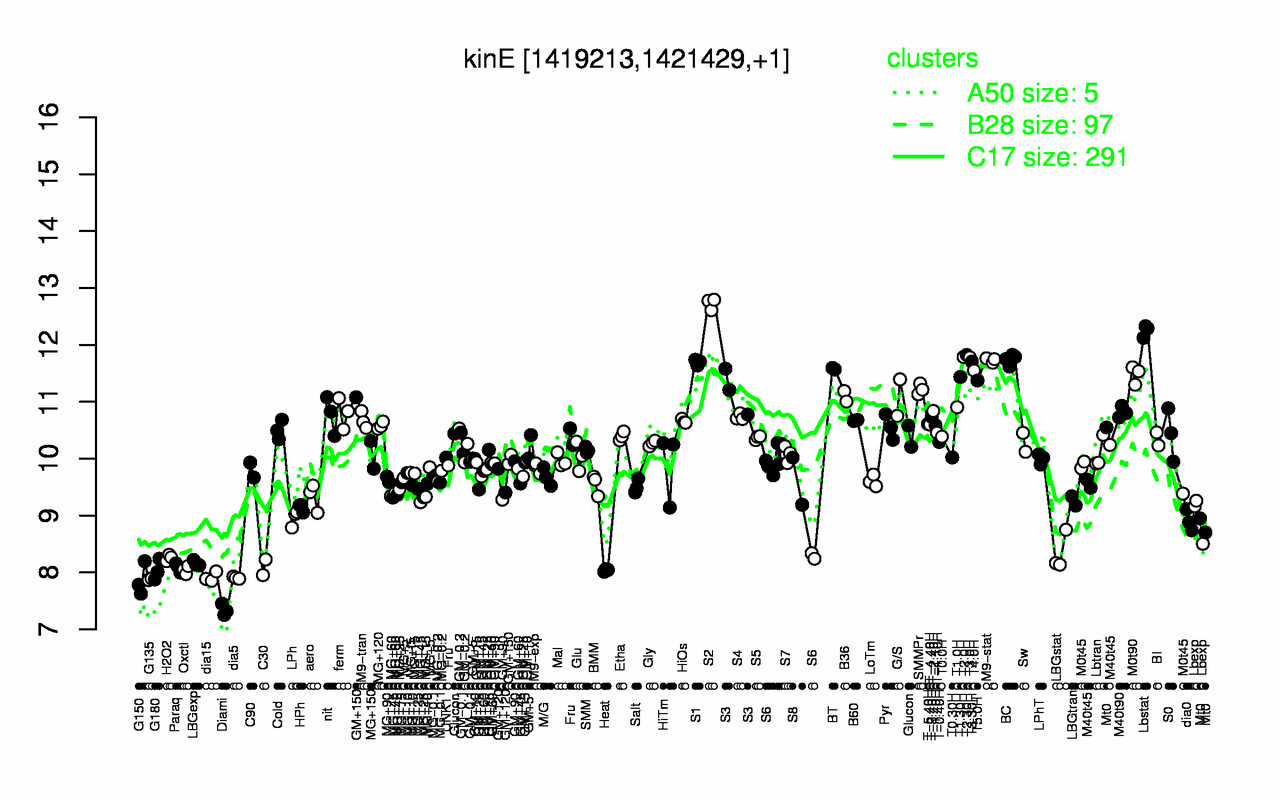
| S2 | Lbstat | T2.30H | T2.0H | T3.0H | BC | M9-stat | T3.30H | S1 | BT |
| 12.7 | 12.2 | 11.8 | 11.8 | 11.8 | 11.7 | 11.7 | 11.7 | 11.7 | 11.6 |
| Diami | G150 | G135 | dia5 | dia15 | Heat | G180 | Oxctl | Paraq | C30 |
| 7.34 | 7.87 | 7.88 | 7.91 | 7.92 | 8.04 | 8.04 | 8.04 | 8.09 | 8.09 |