| Start Page |
|
 |
| Start Page |
|
|
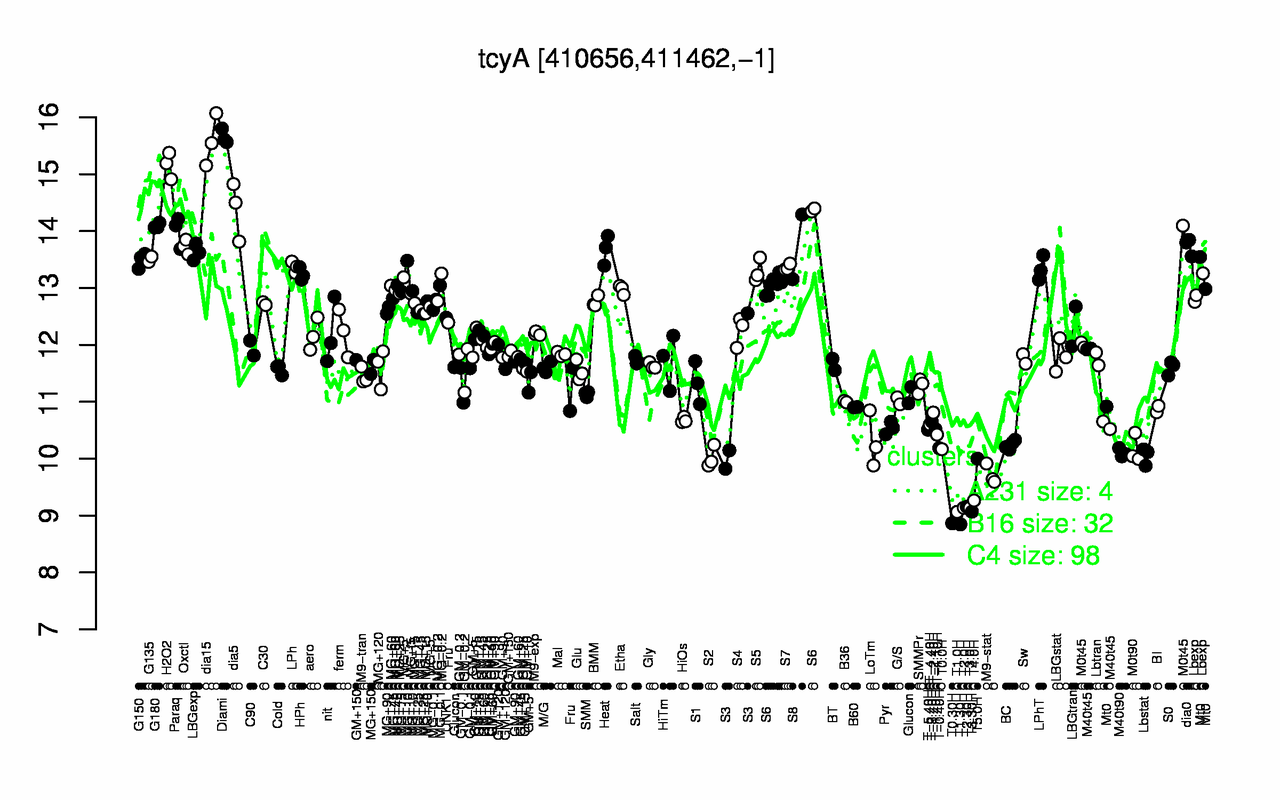
| Diami | dia15 | H2O2 | dia5 | G180 | Paraq | dia0 | Oxctl | S8 | Heat |
| 15.7 | 15.6 | 15.2 | 14.4 | 14.1 | 14 | 13.7 | 13.7 | 13.7 | 13.7 |
| T1.30H | T0.30H | T1.0H | T3.30H | T2.0H | T3.0H | T2.30H | T4.0H | M9-stat | T5.0H |
| 8.85 | 8.86 | 9.06 | 9.07 | 9.13 | 9.14 | 9.15 | 9.27 | 9.72 | 10 |