| Start Page |
|
 |
| Start Page |
|
|
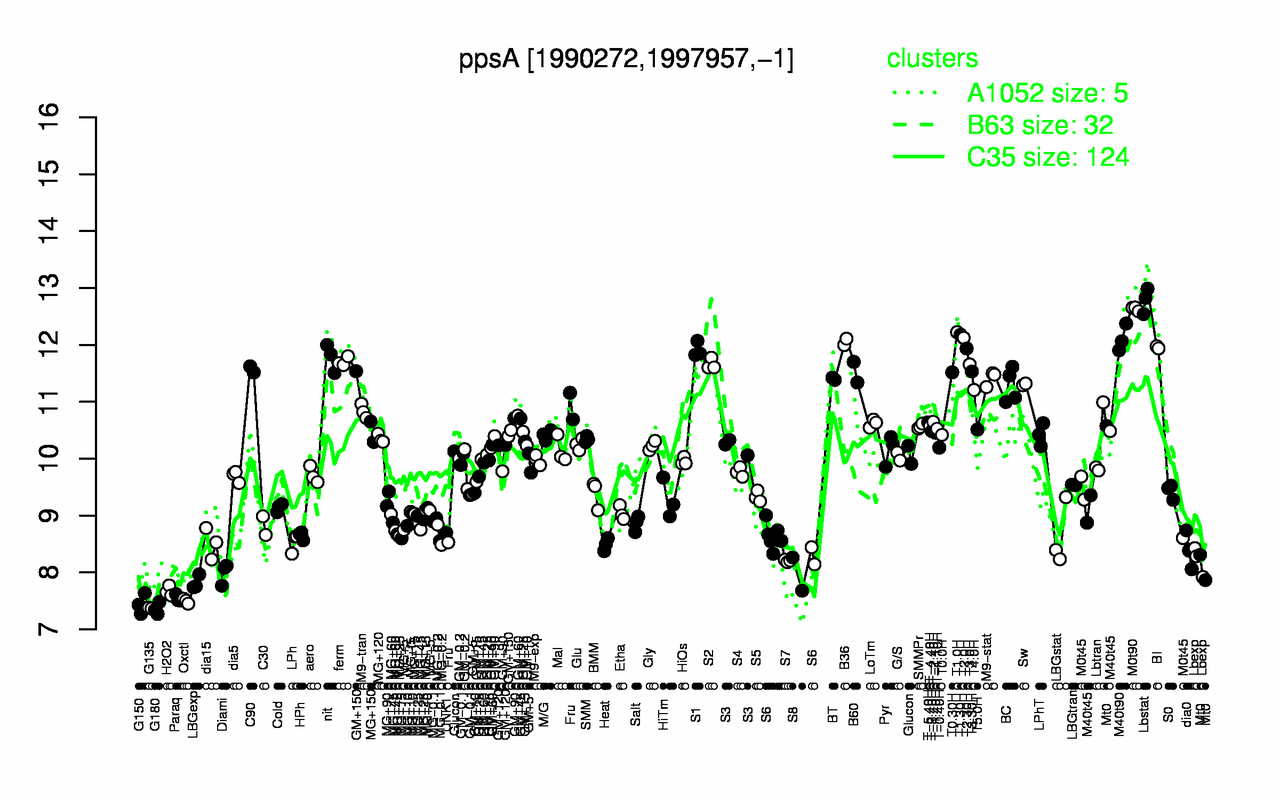
| Lbstat | M0t90 | T1.0H | T1.30H | T2.0H | M40t90 | B36 | BI | T2.30H | S1 |
| 12.8 | 12.6 | 12.2 | 12.2 | 12.1 | 12.1 | 12.1 | 12 | 11.9 | 11.9 |
| G180 | G135 | G150 | Oxctl | Paraq | H2O2 | LBGexp | S8 | Diami | S7 |
| 7.36 | 7.37 | 7.45 | 7.5 | 7.55 | 7.67 | 7.82 | 7.97 | 7.99 | 8.2 |