| Start Page |
|
 |
| Start Page |
|
|
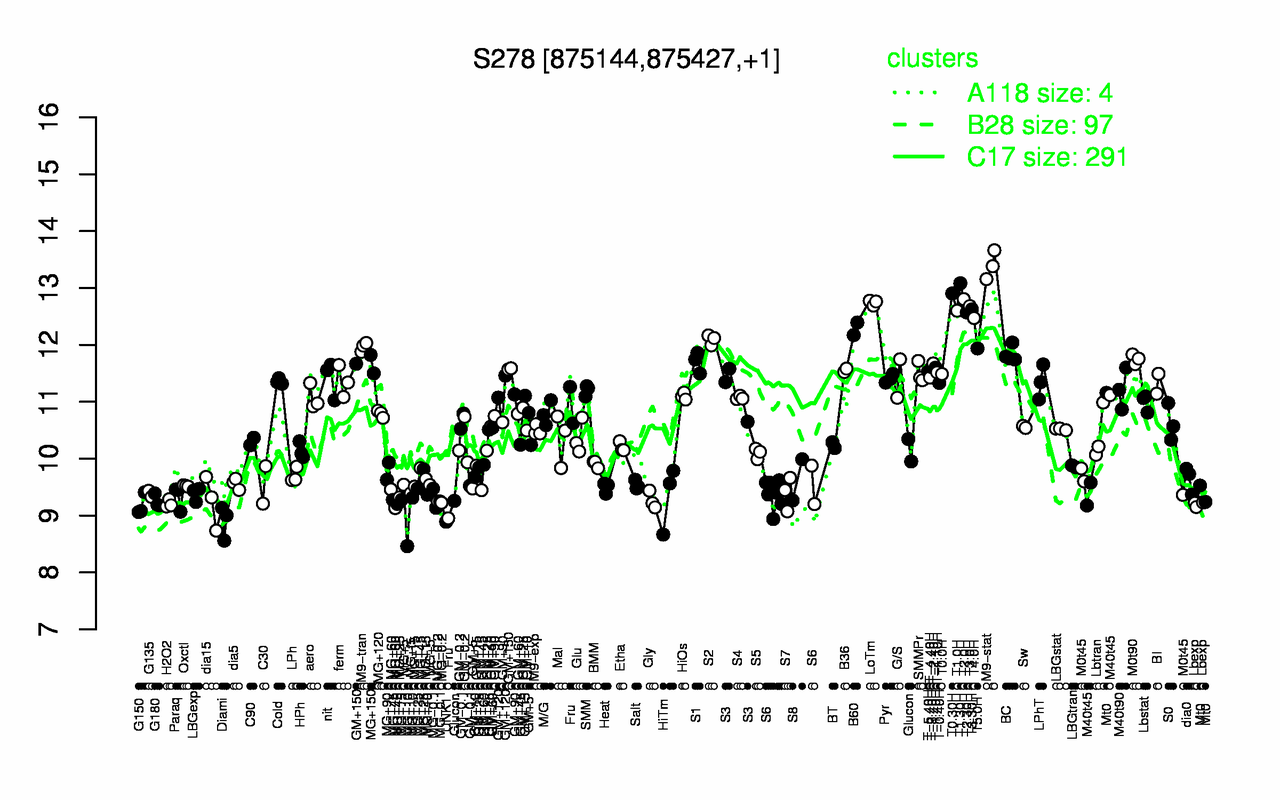
| M9-stat | T1.30H | T0.30H | T2.0H | LoTm | T3.0H | T3.30H | T1.0H | T2.30H | T4.0H |
| 13.4 | 13.1 | 12.9 | 12.8 | 12.7 | 12.7 | 12.6 | 12.6 | 12.6 | 12.5 |
| UNK1 | Diami | MG+10 | G150 | Lbexp | H2O2 | MG-0.2 | dia15 | G180 | Gly |
| 8.89 | 8.9 | 9.05 | 9.18 | 9.2 | 9.21 | 9.24 | 9.24 | 9.25 | 9.27 |