| Start Page |
|
 |
| Start Page |
|
|
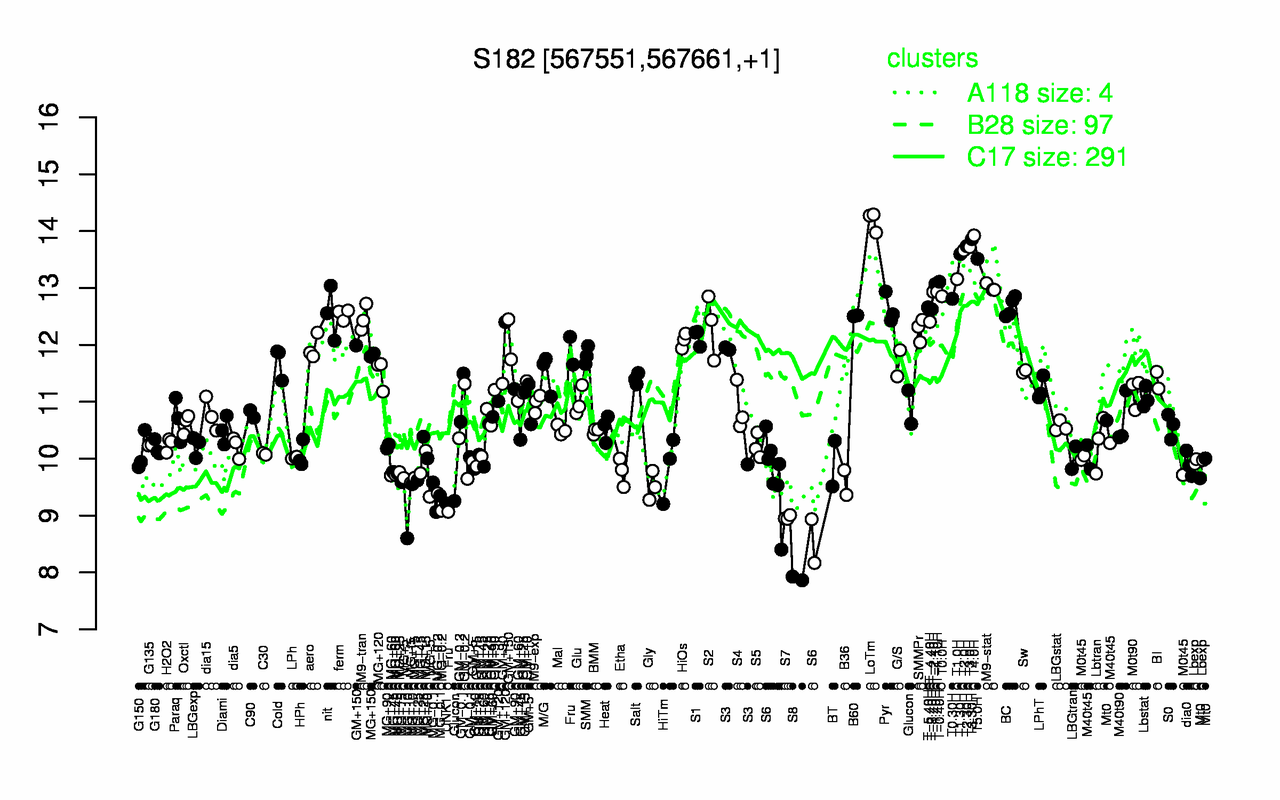
| LoTm | T4.0H | T3.30H | T2.30H | T3.0H | T2.0H | T1.30H | T5.0H | T1.0H | T-0.40H |
| 14.2 | 13.9 | 13.9 | 13.7 | 13.7 | 13.7 | 13.6 | 13.5 | 13.2 | 13.1 |
| S8 | S7 | UNK1 | MG-0.2 | MG-0.1 | MG+10 | S6 | MG+5 | Gly | MG+t5 |
| 7.89 | 8.97 | 9.21 | 9.24 | 9.33 | 9.39 | 9.47 | 9.5 | 9.52 | 9.57 |