| Start Page |
|
 |
| Start Page |
|
|
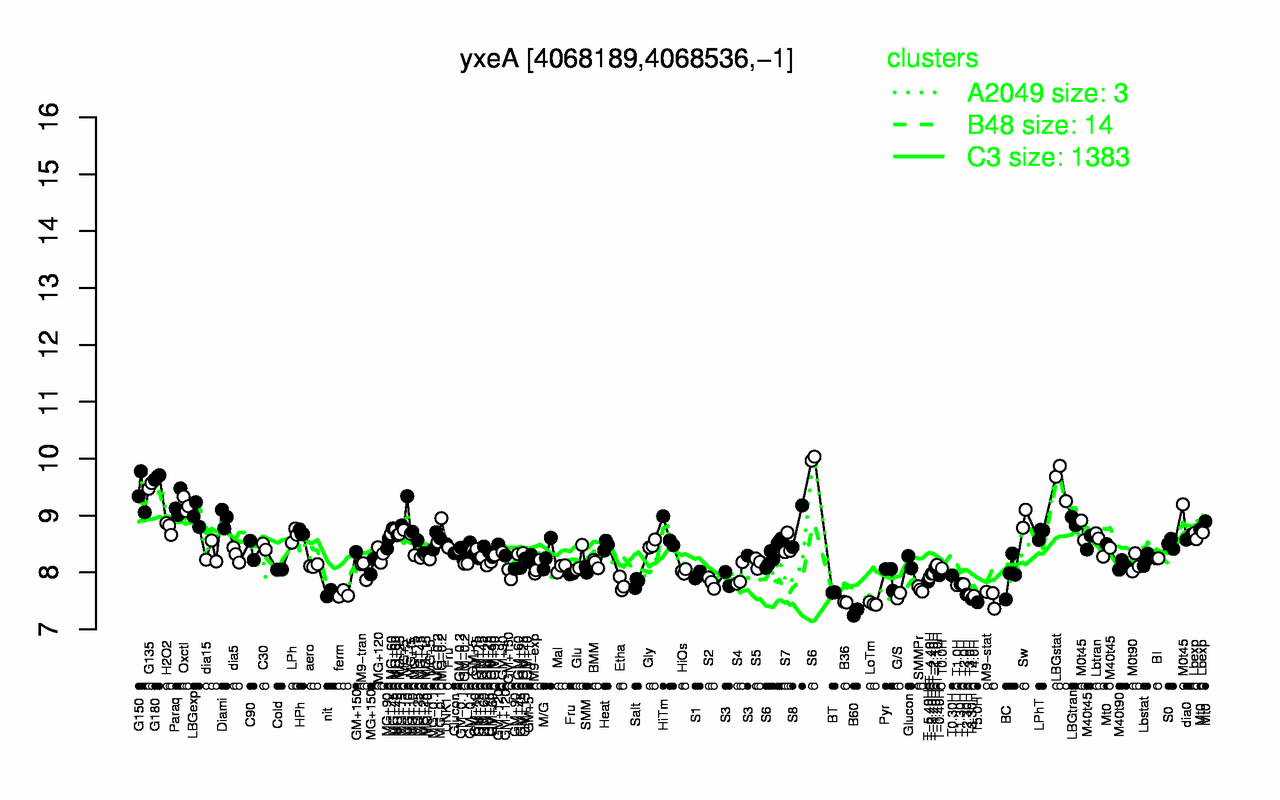
| G180 | LBGstat | G135 | G150 | Paraq | Oxctl | LBGexp | Diami | Sw | LBGtran |
| 9.67 | 9.6 | 9.52 | 9.39 | 9.2 | 9.19 | 9.01 | 8.95 | 8.94 | 8.9 |
| B60 | LoTm | B36 | T5.0H | T3.30H | M9-stat | T4.0H | G/S | T3.0H | T2.30H |
| 7.3 | 7.45 | 7.48 | 7.48 | 7.53 | 7.55 | 7.59 | 7.59 | 7.6 | 7.61 |